


| Duration | 0:00 | Takeoff Distance | 0 |
| Height: | metres |
| Climb: | m/sec |
| Speed: | km/h |
| Distance: | km |
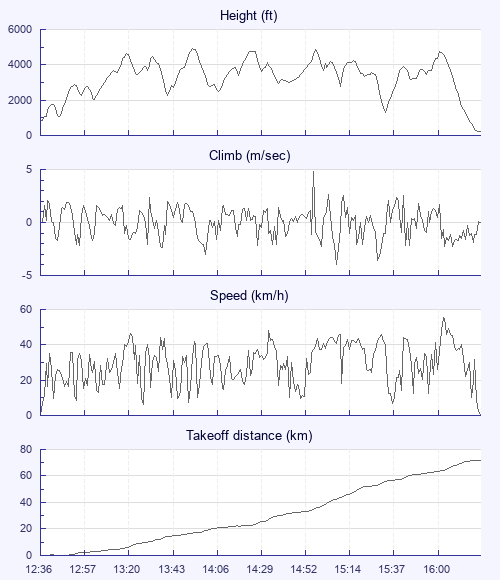
| Height - GPS data | |
| Maximum Height [13:55:47] |
4931 ft |
| Lowest Save [12:45:07] |
1096 ft |
| Takeoff Height [12:36:47] |
860 ft |
| Landing Height [16:25:39] |
213 ft |
| Total Ascent | 24908 ft |
| Height Gain | |
| Above Takeoff | 4072 ft |
| Maximum | 4075 ft |
| Low Point [12:37:37] |
856 ft |
| High Point as Maximum Height |
4931 ft |
| Units | |
| Climb - GPS data | |
| Maximum Climb [15:00:49] |
4.8 m/s |
| Minimum Climb [15:12:09] |
-4.0 m/s |
| Units | |
| Speed | |
| Maximum Speed [16:08:29] |
55.4 km/h |
| Average Speed around course |
19.8 km/h |
| Average Speed over track length |
29.4 km/h |
| Units | |
| Tracklog | |
| Flight Duration | 3hrs 48mins |
| Track Points | 1374 |
| Recording Interval | 10 secs |
| Statistics Interval | 10 secs |
| Track Length | 112.1 km |
| Units | |
| Flight instrument - reported as | |
| GPSMap76C Software Version 3.50 |
| Height: | |
| Speed: | |
| Climb: | |
| Distance: |
| Main Map: |
| First Tab: |