


| Duration | 0:00 | Takeoff Distance | 0 |
| Height: | metres |
| Climb: | m/sec |
| Speed: | km/h |
| Distance: | km |
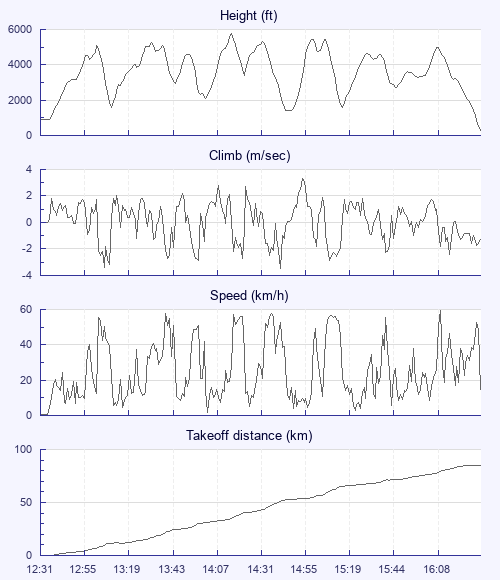
| Height - GPS data | |
| Maximum Height [14:16:41] |
5758 ft |
| Lowest Save [14:47:49] |
1401 ft |
| Takeoff Height [12:31:05] |
883 ft |
| Landing Height [16:34:18] |
279 ft |
| Total Ascent | 26709 ft |
| Height Gain | |
| Above Takeoff | 4875 ft |
| Units | |
| Climb - Pressure data | |
| Maximum Climb [14:55:51] |
3.3 m/s |
| Minimum Climb [14:43:48] |
-3.5 m/s |
| Units | |
| Speed | |
| Maximum Speed [16:12:13] |
59.6 km/h |
| Average Speed around course |
22.7 km/h |
| Average Speed over track length |
25.2 km/h |
| Units | |
| Tracklog | |
| Flight Duration | 4hrs 3mins |
| Track Points | 243 |
| Recording Interval | 60 secs |
| Statistics Interval | 60 secs |
| Track Length | 102.2 km |
| Units | |
| Flight instrument | |
| Type | Brauniger |
| Model | Competino |
| Firmware | 1.16 |
| Height: | |
| Speed: | |
| Climb: | |
| Distance: |
| Main Map: |
| First Tab: |