


| Duration | 0:00 | Takeoff Distance | 0 |
| Height: | metres |
| Climb: | m/sec |
| Speed: | km/h |
| Distance: | km |
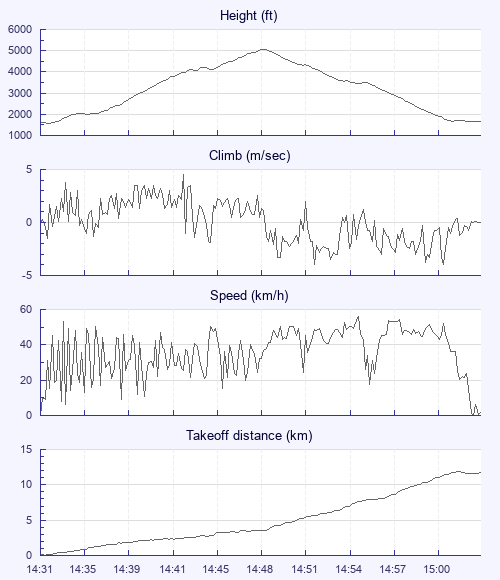
| Height - GPS data | |
| Maximum Height [14:48:59] |
5072 ft |
| Takeoff Height [14:31:36] |
1604 ft |
| Landing Height [15:10:59] |
1654 ft |
| Total Ascent | 4226 ft |
| Height Gain | |
| Above Takeoff | 3468 ft |
| Maximum | 3530 ft |
| Low Point [14:32:29] |
1542 ft |
| High Point as Maximum Height |
5072 ft |
| Units | |
| Climb - GPS data | |
| Maximum Climb [14:42:30] |
4.5 m/s |
| Minimum Climb [14:52:45] |
-4.0 m/s |
| Units | |
| Speed | |
| Maximum Speed [14:55:17] |
56.2 km/h |
| Average Speed around course |
18.0 km/h |
| Average Speed over track length |
29.9 km/h |
| Units | |
| Tracklog | |
| Flight Duration | 39mins |
| Track Points | 738 |
| Recording Interval | 3 secs |
| Statistics Interval | 6 secs |
| Track Length | 19.6 km |
| Units | |
| Flight instrument - reported as | |
| GPSMAP 76S Software Version 3.70 |
| Height: | |
| Speed: | |
| Climb: | |
| Distance: |
| Main Map: |
| First Tab: |