


| Duration | 0:00 | Takeoff Distance | 0 |
| Height: | metres |
| Climb: | m/sec |
| Speed: | km/h |
| Distance: | km |
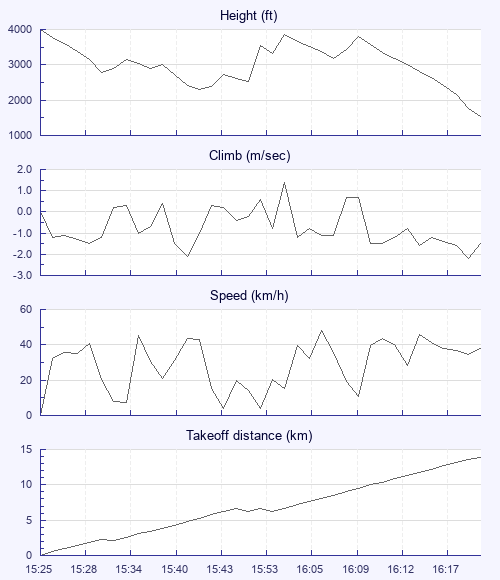
| Height - GPS data | |
| Maximum Height [15:25:36] |
3999 ft |
| Lowest Save [15:43:55] |
2290 ft |
| Takeoff Height [15:25:36] |
3999 ft |
| Landing Height [16:24:26] |
1532 ft |
| Total Ascent | 3051 ft |
| Height Gain | |
| Above Takeoff | 0 ft |
| Maximum | 1555 ft |
| Low Point as Lowest Save |
2290 ft |
| High Point [16:08:51] |
3845 ft |
| Units | |
| Climb - GPS data | |
| Maximum Climb [16:08:51] |
1.4 m/s |
| Minimum Climb [16:23:38] |
-2.2 m/s |
| Units | |
| Speed | |
| Maximum Speed [16:11:11] |
48.1 km/h |
| Average Speed around course |
21.2 km/h |
| Average Speed over track length |
18.6 km/h |
| Units | |
| Tracklog | |
| Flight Duration | 58mins |
| Track Points | 37 |
| Recording Interval | 98 secs |
| Statistics Interval | 98 secs |
| Track Length | 18.2 km |
| Units | |
| Flight instrument - reported as | |
| SP24XC SW2.70 |
| Height: | |
| Speed: | |
| Climb: | |
| Distance: |
| Main Map: |
| First Tab: |