


| Duration | 0:00 | Takeoff Distance | 0 |
| Height: | metres |
| Climb: | m/sec |
| Speed: | km/h |
| Distance: | km |
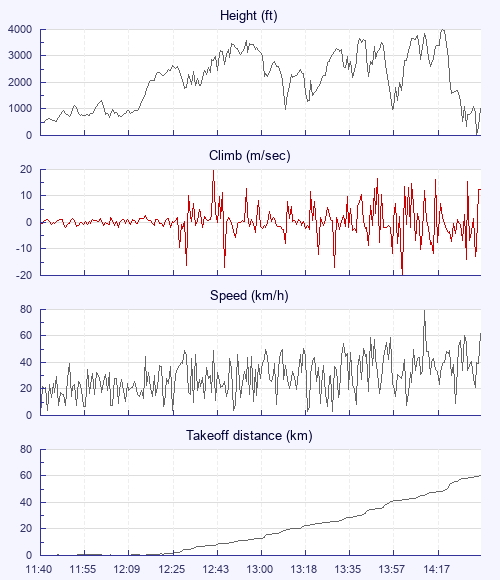
| Height - GPS data | |
| Maximum Height [14:22:11] |
3999 ft |
| Lowest Save [14:40:15] |
0 ft |
| Takeoff Height [11:40:45] |
541 ft |
| Landing Height [14:40:40] |
1033 ft |
| Total Ascent | 57034 ft |
| Height Gain | |
| Above Takeoff | 3458 ft |
| Maximum | 3510 ft |
| Low Point [11:41:44] |
489 ft |
| High Point as Maximum Height |
3999 ft |
| Units | |
| Climb - GPS data | |
| Maximum Climb [12:43:06] |
19.7 m/s |
| Minimum Climb [14:05:22] |
-19.6 m/s |
| Units | |
| Speed | |
| Maximum Speed [14:14:45] |
78.9 km/h |
| Average Speed around course |
20.3 km/h |
| Average Speed over track length |
30.4 km/h |
| Units | |
| Tracklog | |
| Flight Duration | 2hrs 59mins |
| Track Points | 735 |
| Recording Interval | 15 secs |
| Statistics Interval | 15 secs |
| Track Length | 91.3 km |
| Invalid Heights [2.2%] |
16 |
| Units | |
| Flight instrument - reported as | |
| GPS 76 Software Version 2.20 |
| Height: | |
| Speed: | |
| Climb: | |
| Distance: |
| Main Map: |
| First Tab: |