


| Duration | 0:00 | Takeoff Distance | 0 |
| Height: | metres |
| Climb: | m/sec |
| Speed: | km/h |
| Distance: | km |
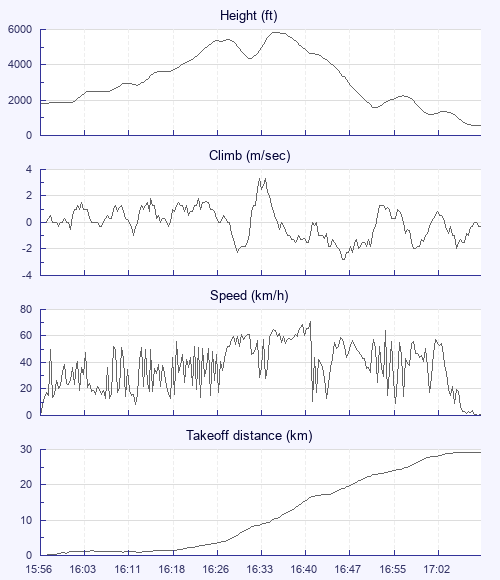
| Height - GPS data | |
| Maximum Height [16:36:31] |
5843 ft |
| Lowest Save [16:53:05] |
1572 ft |
| Takeoff Height [15:56:41] |
1808 ft |
| Landing Height [17:10:11] |
548 ft |
| Total Ascent | 6220 ft |
| Height Gain | |
| Above Takeoff | 4035 ft |
| Maximum | 4039 ft |
| Low Point [15:57:16] |
1804 ft |
| High Point as Maximum Height |
5843 ft |
| Units | |
| Climb - GPS data | |
| Maximum Climb [16:33:51] |
3.3 m/s |
| Minimum Climb [16:47:50] |
-2.8 m/s |
| Units | |
| Speed | |
| Maximum Speed [16:42:24] |
71.1 km/h |
| Average Speed around course |
22.4 km/h |
| Average Speed over track length |
36.3 km/h |
| Units | |
| Tracklog | |
| Flight Duration | 1hr 13mins |
| Track Points | 2158 |
| Recording Interval | 2 secs |
| Statistics Interval | 4 secs |
| Track Length | 44.5 km |
| Units | |
| Height: | |
| Speed: | |
| Climb: | |
| Distance: |
| Main Map: |
| First Tab: |