


| Duration | 0:00 | Takeoff Distance | 0 |
| Height: | metres |
| Climb: | m/sec |
| Speed: | km/h |
| Distance: | km |
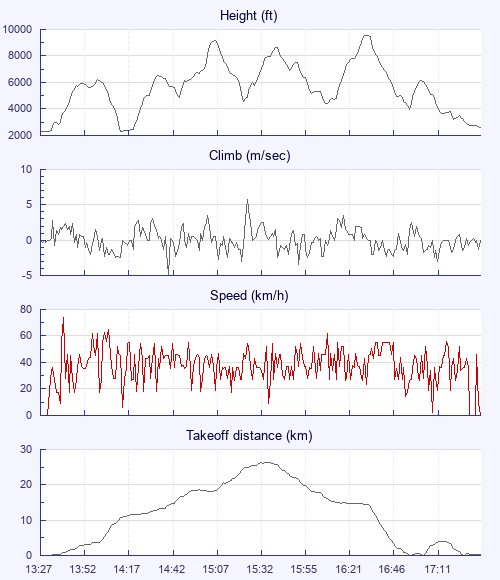
| Height - GPS data | |
| Maximum Height [16:37:00] |
9557 ft |
| Lowest Save [14:15:18] |
2274 ft |
| Takeoff Height [13:27:30] |
2339 ft |
| Landing Height [17:42:12] |
2638 ft |
| Total Ascent | 31716 ft |
| Height Gain | |
| Above Takeoff | 7218 ft |
| Maximum | 7283 ft |
| Low Point as Lowest Save |
2274 ft |
| High Point as Maximum Height |
9557 ft |
| Units | |
| Climb - GPS data | |
| Maximum Climb [15:28:08] |
5.8 m/s |
| Minimum Climb [14:42:31] |
-4.8 m/s |
| Units | |
| Speed | |
| Maximum Speed [13:41:06] |
73.8 km/h |
| Average Speed around course |
13.5 km/h |
| Average Speed over track length |
37.7 km/h |
| Units | |
| Tracklog | |
| Flight Duration | 4hrs 14mins |
| Track Points | 15283 |
| Recording Interval | 1 secs |
| Statistics Interval | 4 secs |
| Track Length | 160.2 km |
| Invalid Positions [< 1%] |
100 |
| Units | |
| Height: | |
| Speed: | |
| Climb: | |
| Distance: |
| Main Map: |
| First Tab: |