


| Duration | 0:00 | Takeoff Distance | 0 |
| Height: | metres |
| Climb: | m/sec |
| Speed: | km/h |
| Distance: | km |
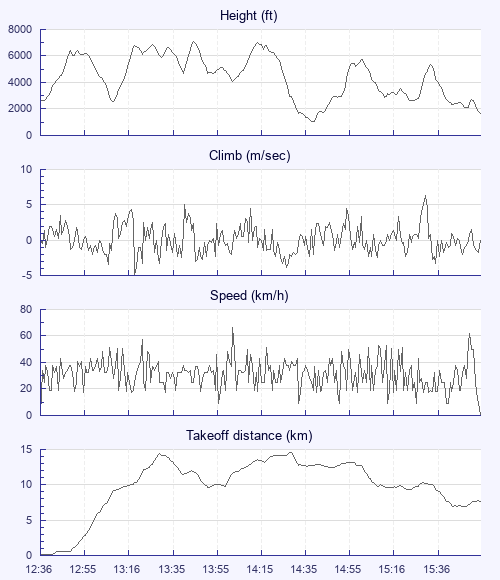
| Height - GPS data | |
| Maximum Height [13:47:19] |
7126 ft |
| Lowest Save [14:43:03] |
1063 ft |
| Takeoff Height [12:36:35] |
2602 ft |
| Landing Height [16:02:27] |
1690 ft |
| Total Ascent | 30043 ft |
| Height Gain | |
| Above Takeoff | 4524 ft |
| Maximum | 4774 ft |
| Low Point as Lowest Save |
1063 ft |
| High Point [15:05:55] |
5837 ft |
| Units | |
| Climb - GPS data | |
| Maximum Climb [15:36:27] |
6.3 m/s |
| Minimum Climb [13:20:43] |
-4.8 m/s |
| Units | |
| Speed | |
| Maximum Speed [14:05:15] |
66.6 km/h |
| Average Speed around course |
6.6 km/h |
| Average Speed over track length |
31.4 km/h |
| Units | |
| Tracklog | |
| Flight Duration | 3hrs 25mins |
| Track Points | 3089 |
| Recording Interval | 4 secs |
| Statistics Interval | 4 secs |
| Track Length | 107.9 km |
| Units | |
| Height: | |
| Speed: | |
| Climb: | |
| Distance: |
| Main Map: |
| First Tab: |