


| Duration | 0:00 | Takeoff Distance | 0 |
| Height: | metres |
| Climb: | m/sec |
| Speed: | km/h |
| Distance: | km |
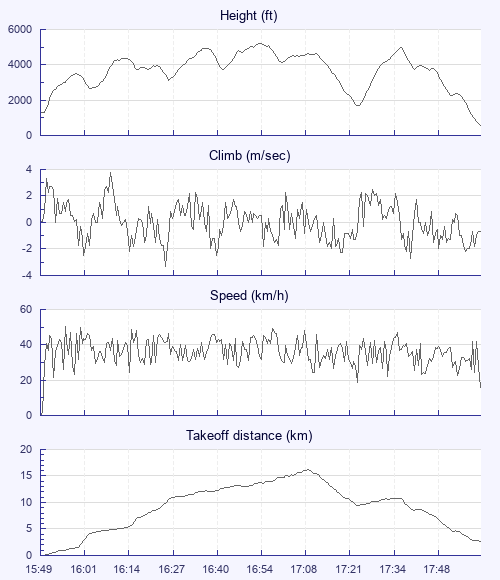
| Height - GPS data | |
| Maximum Height [16:55:31] |
5230 ft |
| Lowest Save [17:25:17] |
1670 ft |
| Takeoff Height [15:49:00] |
1306 ft |
| Landing Height [18:04:05] |
594 ft |
| Total Ascent | 13855 ft |
| Height Gain | |
| Above Takeoff | 3924 ft |
| Units | |
| Climb - GPS data | |
| Maximum Climb [16:09:14] |
3.8 m/s |
| Minimum Climb [16:25:55] |
-3.3 m/s |
| Units | |
| Speed | |
| Maximum Speed [15:55:10] |
50.4 km/h |
| Average Speed around course |
14.3 km/h |
| Average Speed over track length |
35.8 km/h |
| Units | |
| Tracklog | |
| Flight Duration | 2hrs 15mins |
| Track Points | 2688 |
| Recording Interval | 3 secs |
| Statistics Interval | 6 secs |
| Track Length | 80.5 km |
| Units | |
| Flight instrument - reported as | |
| GPSMap60CSX Software Version 2.90 |
| Height: | |
| Speed: | |
| Climb: | |
| Distance: |
| Main Map: |
| First Tab: |