


| Duration | 0:00 | Takeoff Distance | 0 |
| Height: | metres |
| Climb: | m/sec |
| Speed: | km/h |
| Distance: | km |
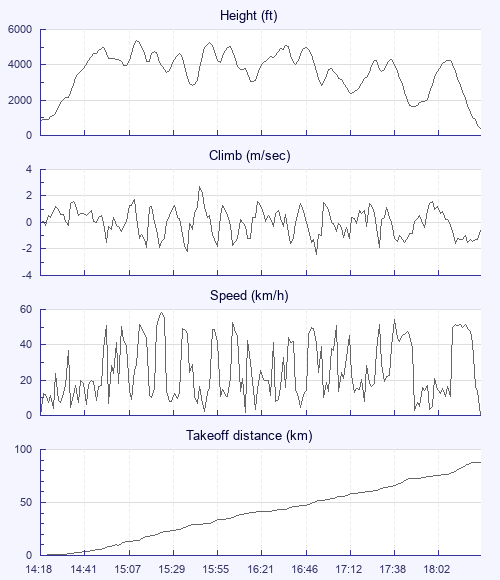
| Height - GPS data | |
| Maximum Height [15:12:40] |
5367 ft |
| Lowest Save [17:53:58] |
1617 ft |
| Takeoff Height [14:18:40] |
876 ft |
| Landing Height [18:32:17] |
423 ft |
| Total Ascent | 20705 ft |
| Height Gain | |
| Above Takeoff | 4491 ft |
| Maximum | 4518 ft |
| Low Point [14:20:42] |
850 ft |
| High Point as Maximum Height |
5367 ft |
| Units | |
| Climb - GPS data | |
| Maximum Climb [15:47:59] |
2.7 m/s |
| Minimum Climb [16:57:31] |
-2.4 m/s |
| Units | |
| Speed | |
| Maximum Speed [15:25:47] |
58.3 km/h |
| Average Speed around course |
21.2 km/h |
| Average Speed over track length |
25.4 km/h |
| Units | |
| Tracklog | |
| Flight Duration | 4hrs 13mins |
| Track Points | 504 |
| Recording Interval | 30 secs |
| Statistics Interval | 30 secs |
| Track Length | 107.3 km |
| Units | |
| Flight instrument - reported as | |
| COMPETINO, SN00080, SW1.16 |
| Height: | |
| Speed: | |
| Climb: | |
| Distance: |
| Main Map: |
| First Tab: |