


| Duration | 0:00 | Takeoff Distance | 0 |
| Height: | metres |
| Climb: | m/sec |
| Speed: | km/h |
| Distance: | km |
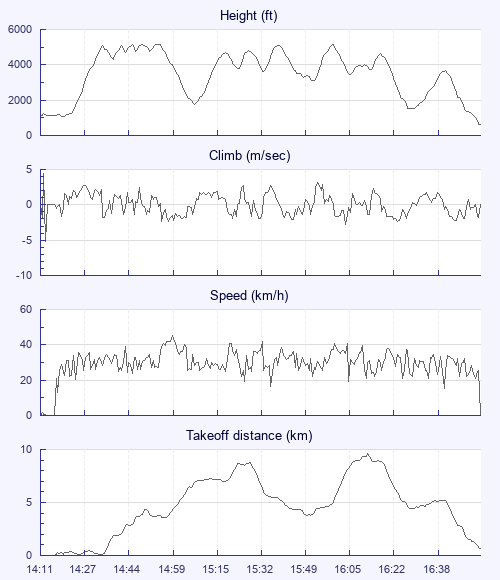
| Height - GPS data | |
| Maximum Height [14:55:03] |
5177 ft |
| Lowest Save [16:31:23] |
1509 ft |
| Takeoff Height [14:11:53] |
1152 ft |
| Landing Height [16:57:13] |
627 ft |
| Total Ascent | 18704 ft |
| Height Gain | |
| Above Takeoff | 4026 ft |
| Maximum | 4180 ft |
| Low Point [14:20:23] |
997 ft |
| High Point as Maximum Height |
5177 ft |
| Units | |
| Climb - GPS data | |
| Maximum Climb [14:12:53] |
4.4 m/s |
| Minimum Climb [14:13:13] |
-5.2 m/s |
| Units | |
| Speed | |
| Maximum Speed [15:00:03] |
45.4 km/h |
| Average Speed around course |
11.6 km/h |
| Average Speed over track length |
28.6 km/h |
| Units | |
| Tracklog | |
| Flight Duration | 2hrs 45mins |
| Track Points | 993 |
| Recording Interval | 10 secs |
| Statistics Interval | 10 secs |
| Track Length | 78.7 km |
| Units | |
| Flight instrument - reported as | |
| SP24XC |
| Height: | |
| Speed: | |
| Climb: | |
| Distance: |
| Main Map: |
| First Tab: |