


| Duration | 0:00 | Takeoff Distance | 0 |
| Height: | metres |
| Climb: | m/sec |
| Speed: | km/h |
| Distance: | km |
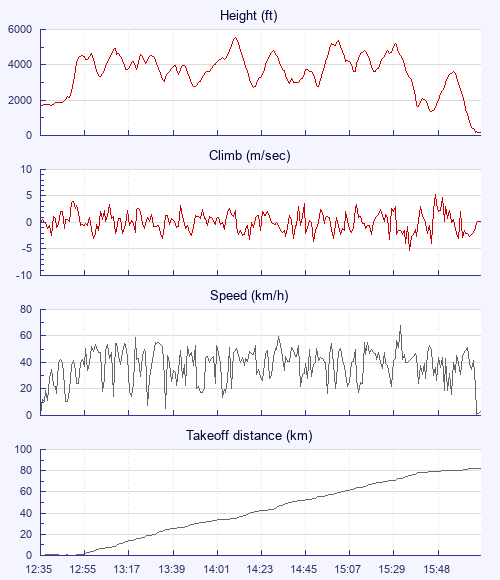
| Height - GPS data | |
| Maximum Height [14:11:40] |
5522 ft |
| Lowest Save [15:47:30] |
1335 ft |
| Takeoff Height [12:35:14] |
1614 ft |
| Landing Height [16:08:40] |
180 ft |
| Total Ascent | 28442 ft |
| Height Gain | |
| Above Takeoff | 3907 ft |
| Units | |
| Climb - GPS data | |
| Maximum Climb [15:48:55] |
5.2 m/s |
| Minimum Climb [15:37:55] |
-5.2 m/s |
| Units | |
| Speed | |
| Maximum Speed [15:34:10] |
67.7 km/h |
| Average Speed around course |
25.1 km/h |
| Average Speed over track length |
37.5 km/h |
| Units | |
| Tracklog | |
| Flight Duration | 3hrs 33mins |
| Track Points | 2559 |
| Recording Interval | 5 secs |
| Statistics Interval | 5 secs |
| Track Length | 133.3 km |
| Invalid Heights [< 1%] |
1 |
| Invalid Heights [< 1%] |
2 |
| Units | |
| Flight instrument - reported as | |
| SP24XC SW2.70 |
| Height: | |
| Speed: | |
| Climb: | |
| Distance: |
| Main Map: |
| First Tab: |