


| Duration | 0:00 | Takeoff Distance | 0 |
| Height: | metres |
| Climb: | m/sec |
| Speed: | km/h |
| Distance: | km |
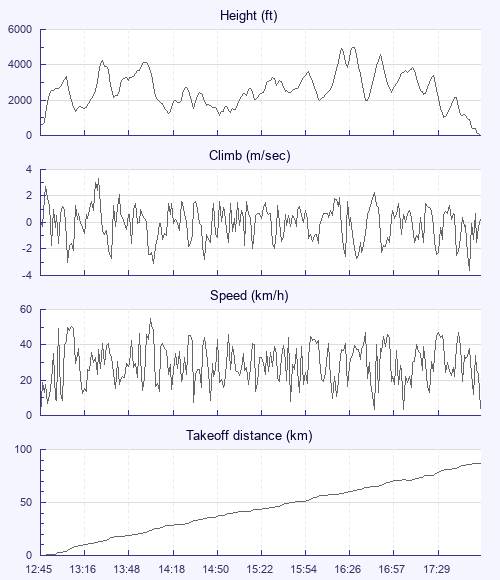
| Height - GPS data | |
| Maximum Height [16:30:34] |
4954 ft |
| Lowest Save [17:36:05] |
1027 ft |
| Takeoff Height [12:45:24] |
636 ft |
| Landing Height [17:58:25] |
20 ft |
| Total Ascent | 26831 ft |
| Height Gain | |
| Above Takeoff | 4318 ft |
| Units | |
| Climb - Pressure data | |
| Maximum Climb [13:26:44] |
3.3 m/s |
| Minimum Climb [17:53:35] |
-3.6 m/s |
| Units | |
| Speed | |
| Maximum Speed [14:03:44] |
55.1 km/h |
| Average Speed around course |
17.4 km/h |
| Average Speed over track length |
28.4 km/h |
| Units | |
| Tracklog | |
| Flight Duration | 5hrs 13mins |
| Track Points | 1879 |
| Recording Interval | 10 secs |
| Statistics Interval | 10 secs |
| Track Length | 148.4 km |
| Units | |
| Flight instrument | |
| Type | Flytec |
| Model | 5030 |
| Firmware | 1.12 |
| Height: | |
| Speed: | |
| Climb: | |
| Distance: |
| Main Map: |
| First Tab: |