


| Duration | 0:00 | Takeoff Distance | 0 |
| Height: | metres |
| Climb: | m/sec |
| Speed: | km/h |
| Distance: | km |
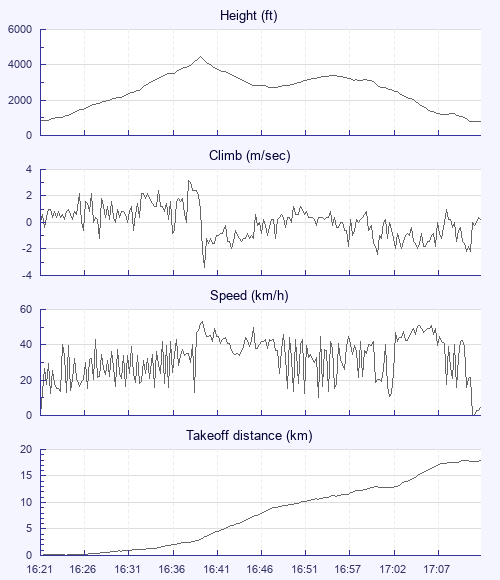
| Height - GPS data | |
| Maximum Height [16:40:23] |
4459 ft |
| Lowest Save [16:49:33] |
2703 ft |
| Takeoff Height [16:21:08] |
843 ft |
| Landing Height [17:14:24] |
791 ft |
| Total Ascent | 4793 ft |
| Height Gain | |
| Above Takeoff | 3615 ft |
| Maximum | 3629 ft |
| Low Point [16:21:13] |
830 ft |
| High Point as Maximum Height |
4459 ft |
| Units | |
| Climb - GPS data | |
| Maximum Climb [16:39:03] |
3.2 m/s |
| Minimum Climb [16:40:53] |
-3.4 m/s |
| Units | |
| Speed | |
| Maximum Speed [16:40:38] |
53.3 km/h |
| Average Speed around course |
21.2 km/h |
| Average Speed over track length |
32.0 km/h |
| Units | |
| Tracklog | |
| Flight Duration | 53mins |
| Track Points | 640 |
| Recording Interval | 5 secs |
| Statistics Interval | 5 secs |
| Track Length | 28.4 km |
| Units | |
| Flight instrument - reported as | |
| GPSMap76CS Software Version 3.90 |
| Height: | |
| Speed: | |
| Climb: | |
| Distance: |
| Main Map: |
| First Tab: |