


| Duration | 0:00 | Takeoff Distance | 0 |
| Height: | metres |
| Climb: | m/sec |
| Speed: | km/h |
| Distance: | km |
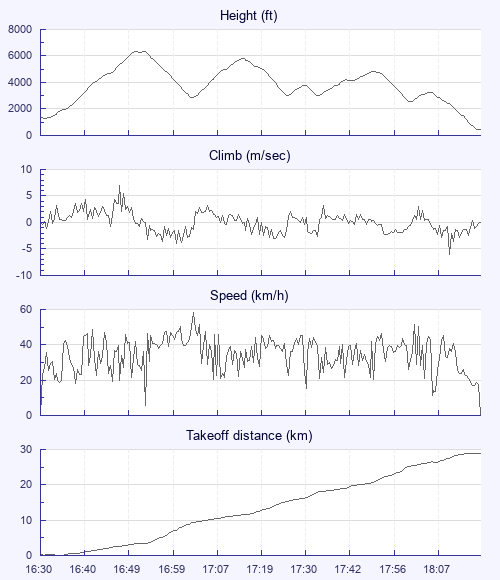
| Height - GPS data | |
| Maximum Height [16:54:01] |
6358 ft |
| Lowest Save [18:03:47] |
2546 ft |
| Takeoff Height [16:30:13] |
1375 ft |
| Landing Height [18:20:43] |
479 ft |
| Total Ascent | 12940 ft |
| Height Gain | |
| Above Takeoff | 4984 ft |
| Maximum | 5079 ft |
| Low Point [16:32:14] |
1280 ft |
| High Point as Maximum Height |
6358 ft |
| Units | |
| Climb - GPS data | |
| Maximum Climb [16:49:03] |
7.0 m/s |
| Minimum Climb [18:14:34] |
-6.0 m/s |
| Units | |
| Speed | |
| Maximum Speed [17:03:40] |
58.2 km/h |
| Average Speed around course |
17.3 km/h |
| Average Speed over track length |
33.3 km/h |
| Units | |
| Tracklog | |
| Flight Duration | 1hr 50mins |
| Track Points | 2609 |
| Recording Interval | 3 secs |
| Statistics Interval | 6 secs |
| Track Length | 61.4 km |
| Units | |
| Flight instrument - reported as | |
| eTrex Vista Software Version 3.20 |
| Height: | |
| Speed: | |
| Climb: | |
| Distance: |
| Main Map: |
| First Tab: |