


| Duration | 0:00 | Takeoff Distance | 0 |
| Height: | metres |
| Climb: | m/sec |
| Speed: | km/h |
| Distance: | km |
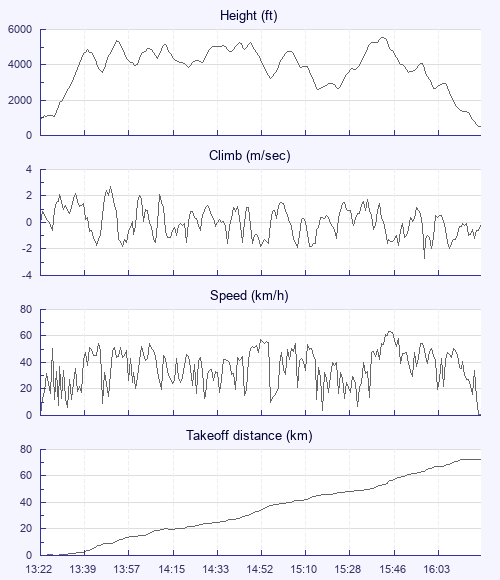
| Height - GPS data | |
| Maximum Height [15:46:00] |
5525 ft |
| Lowest Save [15:19:16] |
2628 ft |
| Takeoff Height [13:22:55] |
915 ft |
| Landing Height [16:25:37] |
502 ft |
| Total Ascent | 15902 ft |
| Height Gain | |
| Above Takeoff | 4610 ft |
| Units | |
| Climb - GPS data | |
| Maximum Climb [13:50:41] |
2.7 m/s |
| Minimum Climb [16:02:33] |
-2.7 m/s |
| Units | |
| Speed | |
| Maximum Speed [15:49:01] |
63.7 km/h |
| Average Speed around course |
20.9 km/h |
| Average Speed over track length |
35.4 km/h |
| Units | |
| Tracklog | |
| Flight Duration | 3hrs 2mins |
| Track Points | 1094 |
| Recording Interval | 10 secs |
| Statistics Interval | 10 secs |
| Track Length | 107.9 km |
| Units | |
| Flight instrument - reported as | |
| GALILEO, SN02785, SW2.22 |
| Height: | |
| Speed: | |
| Climb: | |
| Distance: |
| Main Map: |
| First Tab: |