Xc Title
User:Guest
Cloudbase Paragliding advert
Graeme McCarthy  All flights
National League 2007
Flight type image
Turnpoint Flight on a Paraglider
Club
Derbyshire
Glider
Gradient Aspen 2
Date
8th August 2007
Start
11:40
Finish
15:35
Duration
3hrs 55mins
Takeoff
Sarn
Landing
Knightley
Coords
Takeoff
52.50275, -3.14464
Start
52.50275, -3.14464
TP1
52.50766, -3.14340
TP2
52.49309, -3.13628
TP3
52.50678, -3.14622
Finish
52.34812, -3.05846
Landing
52.34812, -3.05846
Distances and Score
Leg 1
0.55k
Leg 2
1.69k
Leg 3
1.67k
Leg 4
18.63k
Total
22.54k
Multiplier
x 1.00
Score
22.6
Filename
Use full pilot name
Download
Validated
Yes
Flight map
Notes

This map gives an overview of the flight, using the turnpoints to plot the track.

Use the for a detailed map and flight track.

Duration 0:00   Takeoff Distance 0
Controls
To animate the flight: click a point on the track, use the slider, or click the Play button.
slider
slider
Speed
Speed
Slower
Faster
Track color
No data
Highlights
Track data
Time: No data
Height:
Climb:
Speed:
Interval:
Units
Height: metres
Climb: m/sec
Speed: km/h
Distance: km
chart
Notes

Climb and Speed averaged over 9 second intervals.

These values may be lower than those shown by a flight instrument, which has access to continuous raw data.

Metric units are used for all chart data, except for Height which is shown in feet.

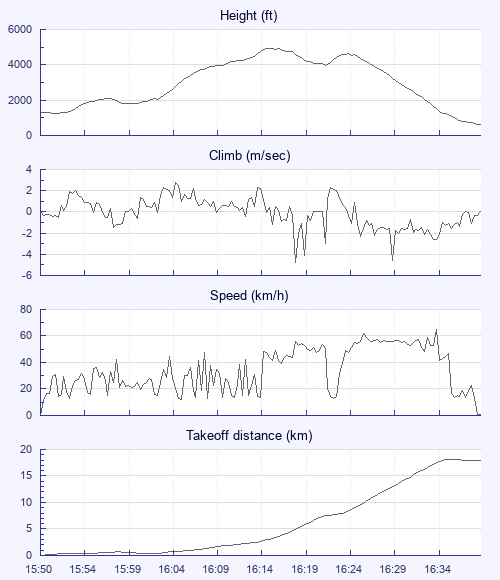
Height   -   Pressure data
Maximum Height
[16:15:38]
4948 ft
Lowest Save
[16:21:38]
3957 ft
Takeoff Height
[15:50:28]
1309 ft
Landing Height
[16:38:48]
636 ft
Total Ascent 4898 ft
Height Gain
Above Takeoff 3638 ft
Maximum 3684 ft
Low Point
[15:52:08]
1263 ft
High Point
as Maximum Height
4948 ft
Units
Climb   -   Pressure data
Maximum Climb
[16:05:08]
2.8 m/s
Minimum Climb
[16:18:28]
-4.8 m/s
Units
Speed
Maximum Speed
[16:34:08]
65.2 km/h
Average Speed
around course
28.0 km/h
Average Speed
over track length
33.9 km/h
Units
Tracklog
Flight Duration 48mins
Track Points 291
Recording Interval 10 secs
Statistics Interval 9 secs
Track Length 27.3 km
Units
Notes

Climb and Speed averaged over 9 second intervals.

These values may be lower than those shown by a flight instrument, which has access to continuous raw data.

Average Speed around course is measured from Takeoff to Landing.

Track Length is the cumulative distance between track points from Takeoff to Landing.

You can change the default units displayed - see the Options page.

Use this page to set various display Options. You can choose which units are used to display flight data, which map to show when the starts and which tab to show each time you view a flight.
Units settings

Metric units are used by default for the Statistics and XC Player pages, except for Height data which is shown in feet. You can choose your own custom settings here.

Height:
Speed:
Climb:
Distance:
  Use default
XC Player settings

When the XC Player starts, the track data is shown on the Hybrid map. You can choose a different map here.

Main Map:
  Use default
Tab settings

The first tab shown when you view a flight is the Flight Map. You can choose a different tab here.

First Tab:
  Use default
Notes

This page uses cookies to save your settings for future visits.

If you have disabled cookies for this site then any changes you make will not be saved.