


| Duration | 0:00 | Takeoff Distance | 0 |
| Height: | metres |
| Climb: | m/sec |
| Speed: | km/h |
| Distance: | km |
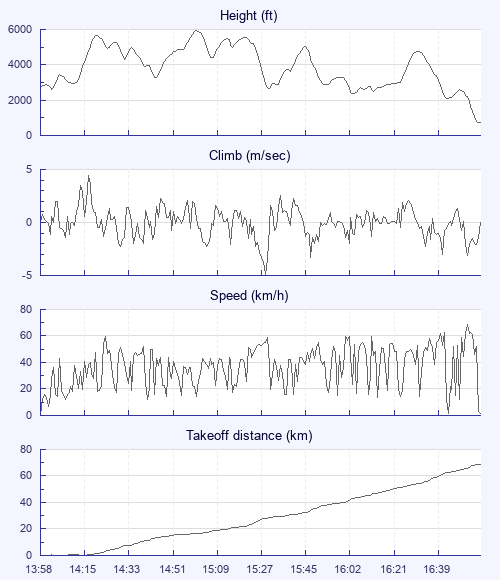
| Height - GPS data | |
| Maximum Height [15:01:43] |
5919 ft |
| Lowest Save [16:44:40] |
2110 ft |
| Takeoff Height [13:58:11] |
2726 ft |
| Landing Height [16:56:20] |
712 ft |
| Total Ascent | 18097 ft |
| Height Gain | |
| Above Takeoff | 3192 ft |
| Maximum | 3343 ft |
| Low Point [14:02:51] |
2575 ft |
| High Point as Maximum Height |
5919 ft |
| Units | |
| Climb - GPS data | |
| Maximum Climb [14:17:07] |
4.4 m/s |
| Minimum Climb [15:29:55] |
-4.9 m/s |
| Units | |
| Speed | |
| Maximum Speed [16:51:56] |
68.9 km/h |
| Average Speed around course |
25.1 km/h |
| Average Speed over track length |
36.1 km/h |
| Units | |
| Tracklog | |
| Flight Duration | 2hrs 58mins |
| Track Points | 2673 |
| Recording Interval | 4 secs |
| Statistics Interval | 7 secs |
| Track Length | 107.1 km |
| Units | |
| Flight instrument - reported as | |
| GPSMAP 76S Software Version 4.00 |
| Height: | |
| Speed: | |
| Climb: | |
| Distance: |
| Main Map: |
| First Tab: |