


| Duration | 0:00 | Takeoff Distance | 0 |
| Height: | metres |
| Climb: | m/sec |
| Speed: | km/h |
| Distance: | km |
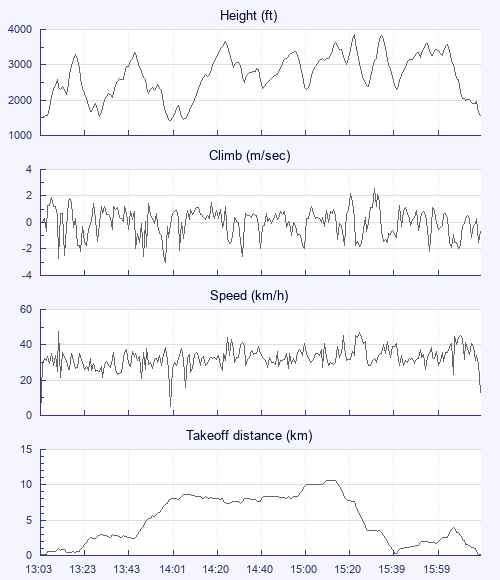
| Height - GPS data | |
| Maximum Height [15:22:34] |
3868 ft |
| Lowest Save [14:00:59] |
1437 ft |
| Takeoff Height [13:03:24] |
1476 ft |
| Landing Height [16:17:19] |
1558 ft |
| Total Ascent | 17093 ft |
| Height Gain | |
| Above Takeoff | 2392 ft |
| Maximum | 2431 ft |
| Low Point as Lowest Save |
1437 ft |
| High Point as Maximum Height |
3868 ft |
| Units | |
| Climb - GPS data | |
| Maximum Climb [15:31:34] |
2.6 m/s |
| Minimum Climb [13:59:44] |
-3.0 m/s |
| Units | |
| Speed | |
| Maximum Speed [13:11:44] |
47.5 km/h |
| Average Speed around course |
11.0 km/h |
| Average Speed over track length |
32.3 km/h |
| Units | |
| Tracklog | |
| Flight Duration | 3hrs 13mins |
| Track Points | 2328 |
| Recording Interval | 5 secs |
| Statistics Interval | 9 secs |
| Track Length | 104.5 km |
| Units | |
| Flight instrument - reported as | |
| GPSMAP 76S Software Version 3.60 |
| Height: | |
| Speed: | |
| Climb: | |
| Distance: |
| Main Map: |
| First Tab: |