


| Duration | 0:00 | Takeoff Distance | 0 |
| Height: | metres |
| Climb: | m/sec |
| Speed: | km/h |
| Distance: | km |
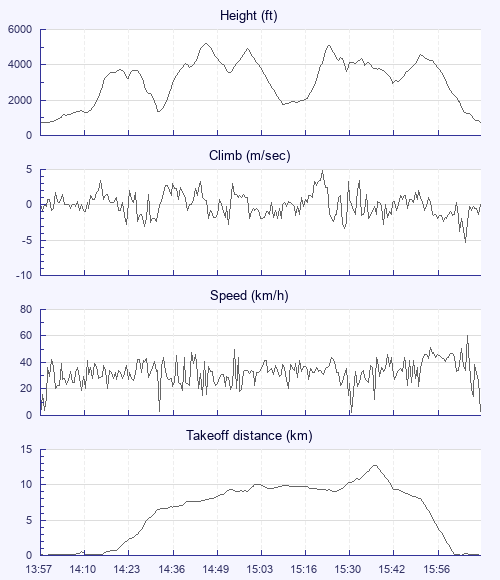
| Height - GPS data | |
| Maximum Height [14:47:52] |
5210 ft |
| Lowest Save [14:33:48] |
1339 ft |
| Takeoff Height [13:57:46] |
735 ft |
| Landing Height [16:11:36] |
732 ft |
| Total Ascent | 17707 ft |
| Height Gain | |
| Above Takeoff | 4475 ft |
| Maximum | 4495 ft |
| Low Point [13:58:34] |
715 ft |
| High Point as Maximum Height |
5210 ft |
| Units | |
| Climb - Pressure data | |
| Maximum Climb [15:24:18] |
4.8 m/s |
| Minimum Climb [16:07:36] |
-5.3 m/s |
| Units | |
| Speed | |
| Maximum Speed [16:07:52] |
60.3 km/h |
| Average Speed around course |
16.2 km/h |
| Average Speed over track length |
32.6 km/h |
| Units | |
| Tracklog | |
| Flight Duration | 2hrs 13mins |
| Track Points | 8029 |
| Recording Interval | 1 secs |
| Statistics Interval | 4 secs |
| Track Length | 72.7 km |
| Units | |
| Flight instrument - reported as | |
| Flymaster F1, V1.21, S/N 1230 |
| Height: | |
| Speed: | |
| Climb: | |
| Distance: |
| Main Map: |
| First Tab: |