


| Duration | 0:00 | Takeoff Distance | 0 |
| Height: | metres |
| Climb: | m/sec |
| Speed: | km/h |
| Distance: | km |
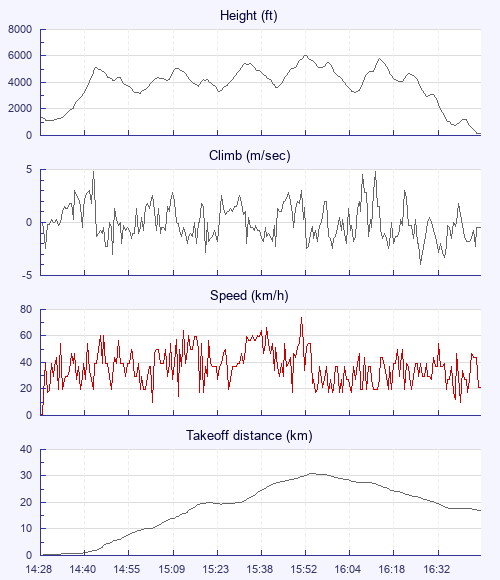
| Height - GPS data | |
| Maximum Height [15:52:46] |
6050 ft |
| Lowest Save [16:39:59] |
784 ft |
| Takeoff Height [14:28:18] |
1378 ft |
| Landing Height [16:47:29] |
125 ft |
| Total Ascent | 17933 ft |
| Height Gain | |
| Above Takeoff | 4672 ft |
| Maximum | 4934 ft |
| Low Point [14:30:17] |
1115 ft |
| High Point as Maximum Height |
6050 ft |
| Units | |
| Climb - GPS data | |
| Maximum Climb [14:43:54] |
4.8 m/s |
| Minimum Climb [16:29:00] |
-4.0 m/s |
| Units | |
| Speed | |
| Maximum Speed [15:52:00] |
73.8 km/h |
| Average Speed around course |
21.8 km/h |
| Average Speed over track length |
37.0 km/h |
| Units | |
| Tracklog | |
| Flight Duration | 2hrs 19mins |
| Track Points | 8352 |
| Recording Interval | 1 secs |
| Statistics Interval | 4 secs |
| Track Length | 85.9 km |
| Invalid Positions [< 1%] |
6 |
| Units | |
| Height: | |
| Speed: | |
| Climb: | |
| Distance: |
| Main Map: |
| First Tab: |