


| Duration | 0:00 | Takeoff Distance | 0 |
| Height: | metres |
| Climb: | m/sec |
| Speed: | km/h |
| Distance: | km |
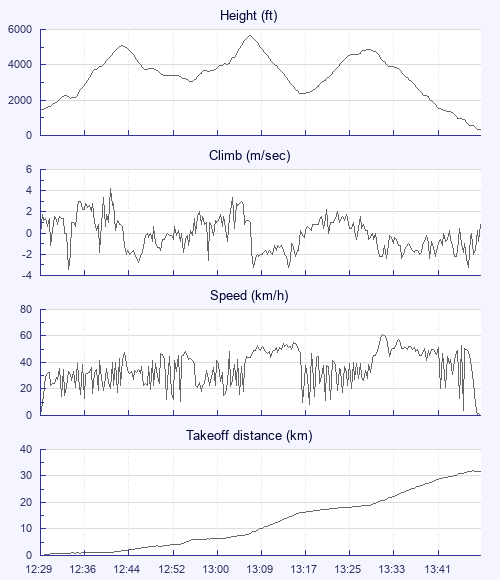
| Height - GPS data | |
| Maximum Height [13:07:22] |
5682 ft |
| Lowest Save [13:17:32] |
2382 ft |
| Takeoff Height [12:29:22] |
1391 ft |
| Landing Height [13:49:57] |
367 ft |
| Total Ascent | 9659 ft |
| Height Gain | |
| Above Takeoff | 4291 ft |
| Units | |
| Climb - GPS data | |
| Maximum Climb [12:41:32] |
4.2 m/s |
| Minimum Climb [12:34:12] |
-3.4 m/s |
| Units | |
| Speed | |
| Maximum Speed [13:32:17] |
61.2 km/h |
| Average Speed around course |
26.1 km/h |
| Average Speed over track length |
36.3 km/h |
| Units | |
| Tracklog | |
| Flight Duration | 1hr 20mins |
| Track Points | 968 |
| Recording Interval | 5 secs |
| Statistics Interval | 5 secs |
| Track Length | 48.8 km |
| Units | |
| Flight instrument - reported as | |
| GPSMap76C Software Version 3.50 |
| Height: | |
| Speed: | |
| Climb: | |
| Distance: |
| Main Map: |
| First Tab: |