


| Duration | 0:00 | Takeoff Distance | 0 |
| Height: | metres |
| Climb: | m/sec |
| Speed: | km/h |
| Distance: | km |
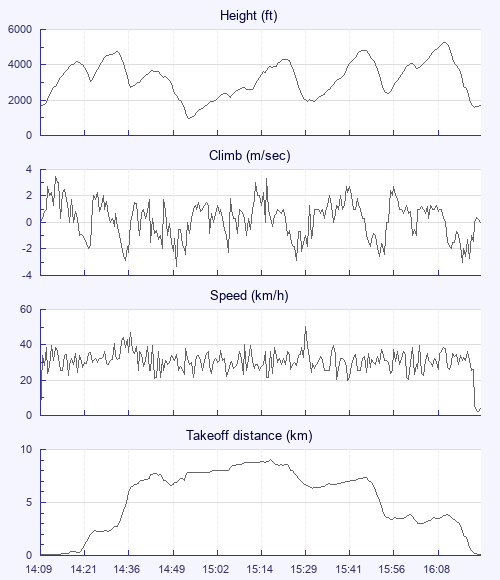
| Height - GPS data | |
| Maximum Height [16:10:57] |
5240 ft |
| Lowest Save [14:54:59] |
974 ft |
| Takeoff Height [14:09:42] |
1686 ft |
| Landing Height [16:25:43] |
1686 ft |
| Total Ascent | 16142 ft |
| Height Gain | |
| Above Takeoff | 3553 ft |
| Maximum | 4265 ft |
| Low Point as Lowest Save |
974 ft |
| High Point as Maximum Height |
5240 ft |
| Units | |
| Climb - GPS data | |
| Maximum Climb [14:13:19] |
3.5 m/s |
| Minimum Climb [14:50:50] |
-3.3 m/s |
| Units | |
| Speed | |
| Maximum Speed [15:29:52] |
50.4 km/h |
| Average Speed around course |
10.9 km/h |
| Average Speed over track length |
30.4 km/h |
| Units | |
| Tracklog | |
| Flight Duration | 2hrs 16mins |
| Track Points | 2049 |
| Recording Interval | 4 secs |
| Statistics Interval | 4 secs |
| Track Length | 69.0 km |
| Units | |
| Flight instrument - reported as | |
| GPSMap76CSX Software Version 4.00 |
| Height: | |
| Speed: | |
| Climb: | |
| Distance: |
| Main Map: |
| First Tab: |