Xc Title
User:Guest
Cloudbase Paragliding advert
Philip Wallbank  All flights
Pennine League 2011
Flight type image
Turnpoint Flight on a Paraglider
Club
Pennine
Glider
Gradient Aspen 3
Date
19th March 2011
Start
11:56
Finish
15:09
Duration
3hrs 12mins
Takeoff
Parlick
Landing
Burnsall
Coords
Takeoff
53.89945, -2.61918
Start
53.89945, -2.61918
TP1
53.91808, -2.64853
TP2
53.90962, -2.61465
TP3
53.89632, -2.64865
Finish
54.04993, -1.93440
Landing
54.04990, -1.93502
Distances and Score
Leg 1
2.83k
Leg 2
2.42k
Leg 3
2.68k
Leg 4
49.89k
Total
57.82k
Score
57.8
Open Distance
Total
49.9k
Filename
Use full pilot name
Download
Validated
Yes
Flight map
Notes

This map gives an overview of the flight, using the turnpoints to plot the track.

Use the for a detailed map and flight track.

Duration 0:00   Takeoff Distance 0
Controls
To animate the flight: click a point on the track, use the slider, or click the Play button.
slider
slider
Speed
Speed
Slower
Faster
Track color
No data
Highlights
Track data
Time: No data
Height:
Climb:
Speed:
Interval:
Units
Height: metres
Climb: m/sec
Speed: km/h
Distance: km
chart
Notes

Climb and Speed averaged over 6 second intervals.

These values may be lower than those shown by a flight instrument, which has access to continuous raw data.

Red values indicate suspect data, because the tracklog contains invalid points.

Metric units are used for all chart data, except for Height which is shown in feet.

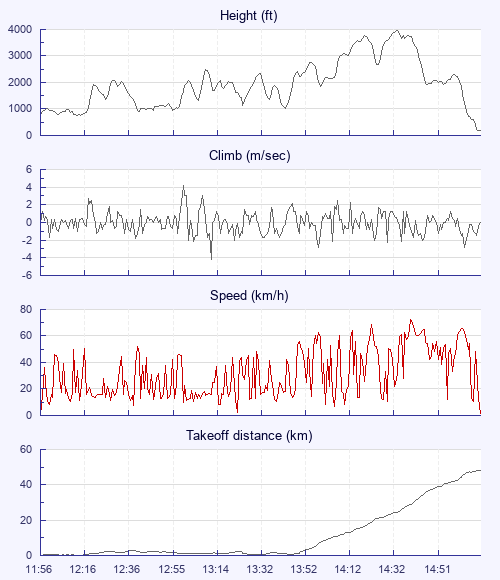
Height   -   Pressure data
Maximum Height
[14:34:31]
3967 ft
Lowest Save
[12:40:24]
915 ft
Takeoff Height
[11:56:42]
758 ft
Landing Height
[15:09:36]
200 ft
Total Ascent 18350 ft
Height Gain
Above Takeoff 3209 ft
Maximum 3219 ft
Low Point
[12:15:07]
748 ft
High Point
as Maximum Height
3967 ft
Units
Climb   -   Pressure data
Maximum Climb
[12:59:50]
4.2 m/s
Minimum Climb
[13:11:36]
-4.2 m/s
Units
Speed
Maximum Speed
[14:40:12]
72.6 km/h
Average Speed
around course
18.0 km/h
Average Speed
over track length
31.6 km/h
Units
Tracklog
Flight Duration 3hrs 12mins
Track Points 3833
Recording Interval 3 secs
Statistics Interval 6 secs
Track Length 101.6 km
Invalid Positions
[< 1%]
2
Units
Flight instrument   -   reported as
6020 SN06397 SW3.07
Notes

Climb and Speed averaged over 6 second intervals.

These values may be lower than those shown by a flight instrument, which has access to continuous raw data.

Red values indicate suspect data, because the tracklog contains invalid points.

Average Speed around course is measured from Start to Finish points.

Track Length is the cumulative distance between track points from Takeoff to Landing.

You can change the default units displayed - see the Options page.

Use this page to set various display Options. You can choose which units are used to display flight data, which map to show when the starts and which tab to show each time you view a flight.
Units settings

Metric units are used by default for the Statistics and XC Player pages, except for Height data which is shown in feet. You can choose your own custom settings here.

Height:
Speed:
Climb:
Distance:
  Use default
XC Player settings

When the XC Player starts, the track data is shown on the Hybrid map. You can choose a different map here.

Main Map:
  Use default
Tab settings

The first tab shown when you view a flight is the Flight Map. You can choose a different tab here.

First Tab:
  Use default
Notes

This page uses cookies to save your settings for future visits.

If you have disabled cookies for this site then any changes you make will not be saved.