


| Duration | 0:00 | Takeoff Distance | 0 |
| Height: | metres |
| Climb: | m/sec |
| Speed: | km/h |
| Distance: | km |
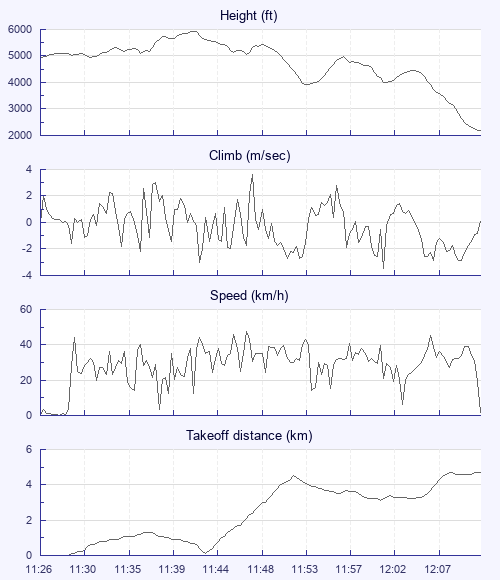
| Height - GPS data | |
| Maximum Height [11:41:59] |
5928 ft |
| Lowest Save [11:53:39] |
3914 ft |
| Takeoff Height [11:26:29] |
4898 ft |
| Landing Height [12:11:38] |
2205 ft |
| Total Ascent | 4003 ft |
| Height Gain | |
| Above Takeoff | 1030 ft |
| Maximum | 1073 ft |
| Low Point as Lowest Save |
3914 ft |
| High Point [11:57:29] |
4987 ft |
| Units | |
| Climb - GPS data | |
| Maximum Climb [11:48:09] |
3.6 m/s |
| Minimum Climb [12:01:49] |
-3.5 m/s |
| Units | |
| Speed | |
| Maximum Speed [11:47:29] |
47.5 km/h |
| Average Speed around course |
17.1 km/h |
| Average Speed over track length |
28.4 km/h |
| Units | |
| Tracklog | |
| Flight Duration | 45mins |
| Track Points | 272 |
| Recording Interval | 10 secs |
| Statistics Interval | 10 secs |
| Track Length | 21.4 km |
| Units | |
| Flight instrument - reported as | |
| GPSMAP 76S Software Version 4.00 |
| Height: | |
| Speed: | |
| Climb: | |
| Distance: |
| Main Map: |
| First Tab: |