


| Duration | 0:00 | Takeoff Distance | 0 |
| Height: | metres |
| Climb: | m/sec |
| Speed: | km/h |
| Distance: | km |
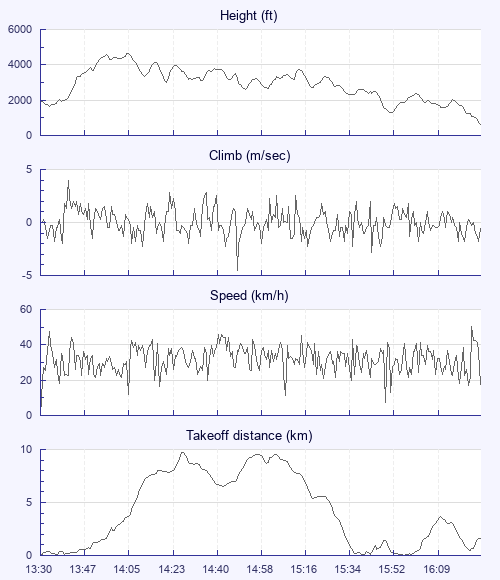
| Height - GPS data | |
| Maximum Height [14:06:11] |
4659 ft |
| Lowest Save [15:53:59] |
1289 ft |
| Takeoff Height [13:30:44] |
1926 ft |
| Landing Height [16:30:22] |
650 ft |
| Total Ascent | 17618 ft |
| Height Gain | |
| Above Takeoff | 2733 ft |
| Maximum | 3018 ft |
| Low Point [13:33:39] |
1640 ft |
| High Point as Maximum Height |
4659 ft |
| Units | |
| Climb - GPS data | |
| Maximum Climb [13:41:32] |
4.0 m/s |
| Minimum Climb [14:50:40] |
-4.5 m/s |
| Units | |
| Speed | |
| Maximum Speed [16:27:24] |
50.4 km/h |
| Average Speed around course |
12.0 km/h |
| Average Speed over track length |
31.1 km/h |
| Units | |
| Tracklog | |
| Flight Duration | 2hrs 59mins |
| Track Points | 10779 |
| Recording Interval | 1 secs |
| Statistics Interval | 4 secs |
| Track Length | 93.2 km |
| Units | |
| Flight instrument - reported as | |
| XC Trainer V3.1-07, S/N 7126 |
| Height: | |
| Speed: | |
| Climb: | |
| Distance: |
| Main Map: |
| First Tab: |