


| Duration | 0:00 | Takeoff Distance | 0 |
| Height: | metres |
| Climb: | m/sec |
| Speed: | km/h |
| Distance: | km |
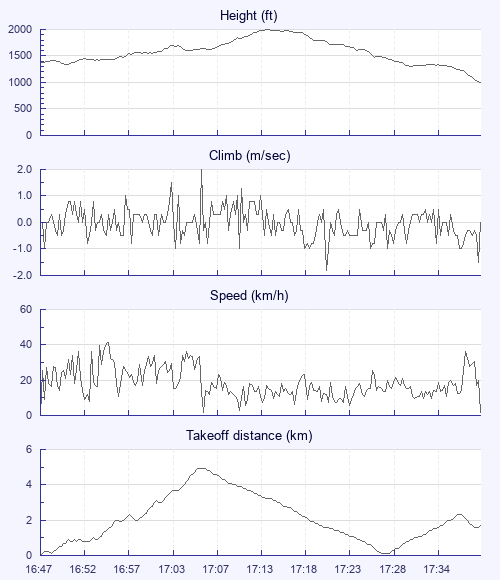
| Height - GPS data | |
| Maximum Height [17:15:02] |
1995 ft |
| Takeoff Height [16:47:21] |
1375 ft |
| Landing Height [17:40:47] |
994 ft |
| Total Ascent | 1745 ft |
| Height Gain | |
| Above Takeoff | 620 ft |
| Maximum | 656 ft |
| Low Point [16:50:29] |
1339 ft |
| High Point as Maximum Height |
1995 ft |
| Units | |
| Climb - GPS data | |
| Maximum Climb [17:07:02] |
2.0 m/s |
| Minimum Climb [17:22:06] |
-1.8 m/s |
| Units | |
| Speed | |
| Maximum Speed [16:55:41] |
41.4 km/h |
| Average Speed around course |
14.6 km/h |
| Average Speed over track length |
18.3 km/h |
| Units | |
| Tracklog | |
| Flight Duration | 53mins |
| Track Points | 801 |
| Recording Interval | 4 secs |
| Statistics Interval | 4 secs |
| Track Length | 16.3 km |
| Units | |
| Flight instrument - reported as | |
| Garmin USB: eTrex Vista HCx Software Version 3.20 |
| Height: | |
| Speed: | |
| Climb: | |
| Distance: |
| Main Map: |
| First Tab: |