


| Duration | 0:00 | Takeoff Distance | 0 |
| Height: | metres |
| Climb: | m/sec |
| Speed: | km/h |
| Distance: | km |
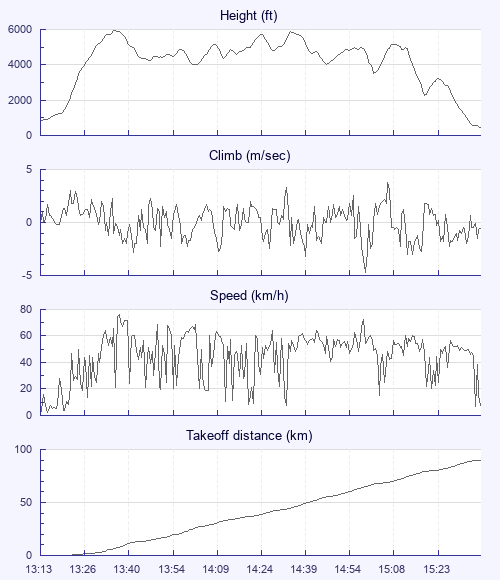
| Height - GPS data | |
| Maximum Height [13:37:00] |
5961 ft |
| Lowest Save [15:20:34] |
2287 ft |
| Takeoff Height [13:13:20] |
804 ft |
| Landing Height [15:38:25] |
427 ft |
| Total Ascent | 13993 ft |
| Height Gain | |
| Above Takeoff | 5157 ft |
| Units | |
| Climb - Pressure data | |
| Maximum Climb [15:08:18] |
3.8 m/s |
| Minimum Climb [15:00:58] |
-4.7 m/s |
| Units | |
| Speed | |
| Maximum Speed [13:37:33] |
76.2 km/h |
| Average Speed around course |
38.4 km/h |
| Average Speed over track length |
44.6 km/h |
| Units | |
| Tracklog | |
| Flight Duration | 2hrs 25mins |
| Track Points | 2888 |
| Recording Interval | 3 secs |
| Statistics Interval | 6 secs |
| Track Length | 107.9 km |
| Units | |
| Flight instrument - reported as | |
| GALILEO SN02767 SW2.27 |
| Height: | |
| Speed: | |
| Climb: | |
| Distance: |
| Main Map: |
| First Tab: |