


| Duration | 0:00 | Takeoff Distance | 0 |
| Height: | metres |
| Climb: | m/sec |
| Speed: | km/h |
| Distance: | km |
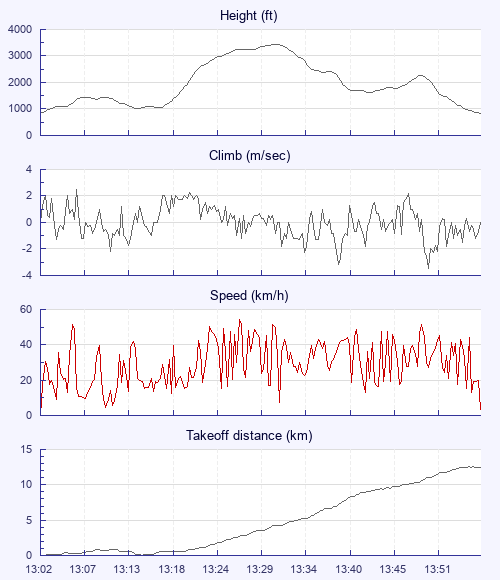
| Height - GPS data | |
| Maximum Height [13:31:52] |
3425 ft |
| Lowest Save [13:44:01] |
1604 ft |
| Takeoff Height [13:02:14] |
856 ft |
| Landing Height [13:57:44] |
827 ft |
| Total Ascent | 3862 ft |
| Height Gain | |
| Above Takeoff | 2569 ft |
| Maximum | 2572 ft |
| Low Point [13:02:17] |
853 ft |
| High Point as Maximum Height |
3425 ft |
| Units | |
| Climb - Pressure data | |
| Maximum Climb [13:06:27] |
2.5 m/s |
| Minimum Climb [13:51:30] |
-3.5 m/s |
| Units | |
| Speed | |
| Maximum Speed [13:27:45] |
54.6 km/h |
| Average Speed around course |
17.0 km/h |
| Average Speed over track length |
29.7 km/h |
| Units | |
| Tracklog | |
| Flight Duration | 55mins |
| Track Points | 1106 |
| Recording Interval | 3 secs |
| Statistics Interval | 6 secs |
| Track Length | 27.5 km |
| Invalid Positions [< 1%] |
1 |
| Units | |
| Flight instrument - reported as | |
| GALILEO SN02767 SW2.27 |
| Height: | |
| Speed: | |
| Climb: | |
| Distance: |
| Main Map: |
| First Tab: |