


| Duration | 0:00 | Takeoff Distance | 0 |
| Height: | metres |
| Climb: | m/sec |
| Speed: | km/h |
| Distance: | km |
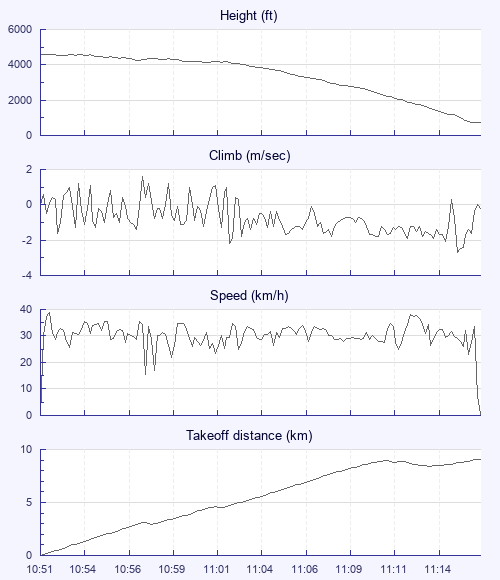
| Height - GPS data | |
| Maximum Height [10:52:36] |
4593 ft |
| Takeoff Height [10:51:46] |
4564 ft |
| Landing Height [11:17:16] |
741 ft |
| Total Ascent | 584 ft |
| Height Gain | |
| Above Takeoff | 30 ft |
| Maximum | 112 ft |
| Low Point [10:57:26] |
4252 ft |
| High Point [10:58:06] |
4364 ft |
| Units | |
| Climb - GPS data | |
| Maximum Climb [10:57:36] |
1.6 m/s |
| Minimum Climb [11:15:36] |
-2.7 m/s |
| Units | |
| Speed | |
| Maximum Speed [10:52:16] |
38.9 km/h |
| Average Speed around course |
26.7 km/h |
| Average Speed over track length |
29.9 km/h |
| Units | |
| Tracklog | |
| Flight Duration | 25mins |
| Track Points | 152 |
| Recording Interval | 10 secs |
| Statistics Interval | 10 secs |
| Track Length | 12.7 km |
| Units | |
| Flight instrument - reported as | |
| GPSMap76C Software Version 4.10 |
| Height: | |
| Speed: | |
| Climb: | |
| Distance: |
| Main Map: |
| First Tab: |