


| Duration | 0:00 | Takeoff Distance | 0 |
| Height: | metres |
| Climb: | m/sec |
| Speed: | km/h |
| Distance: | km |
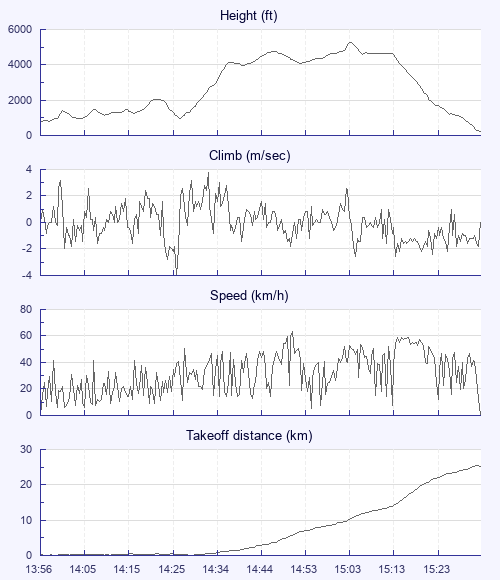
| Height - GPS data | |
| Maximum Height [15:03:55] |
5259 ft |
| Lowest Save [14:05:40] |
948 ft |
| Takeoff Height [13:56:23] |
784 ft |
| Landing Height [15:32:35] |
217 ft |
| Total Ascent | 8822 ft |
| Height Gain | |
| Above Takeoff | 4475 ft |
| Maximum | 4478 ft |
| Low Point [13:56:25] |
781 ft |
| High Point as Maximum Height |
5259 ft |
| Units | |
| Climb - Pressure data | |
| Maximum Climb [14:32:10] |
3.8 m/s |
| Minimum Climb [14:25:40] |
-4.0 m/s |
| Units | |
| Speed | |
| Maximum Speed [14:51:00] |
63.4 km/h |
| Average Speed around course |
20.1 km/h |
| Average Speed over track length |
31.7 km/h |
| Units | |
| Tracklog | |
| Flight Duration | 1hr 36mins |
| Track Points | 1156 |
| Recording Interval | 5 secs |
| Statistics Interval | 5 secs |
| Track Length | 50.8 km |
| Units | |
| Flight instrument - reported as | |
| IQ-BASIC |
| Height: | |
| Speed: | |
| Climb: | |
| Distance: |
| Main Map: |
| First Tab: |