


| Duration | 0:00 | Takeoff Distance | 0 |
| Height: | metres |
| Climb: | m/sec |
| Speed: | km/h |
| Distance: | km |
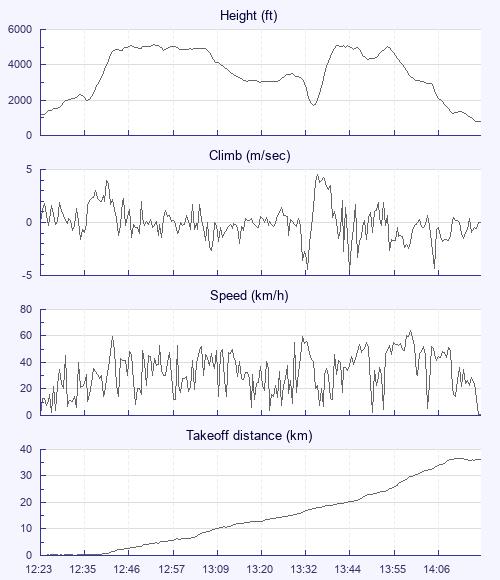
| Height - GPS data | |
| Maximum Height [12:53:30] |
5128 ft |
| Lowest Save [13:35:28] |
1690 ft |
| Takeoff Height [12:23:58] |
1145 ft |
| Landing Height [14:16:53] |
771 ft |
| Total Ascent | 10144 ft |
| Height Gain | |
| Above Takeoff | 3983 ft |
| Units | |
| Climb - Pressure data | |
| Maximum Climb [13:36:28] |
4.5 m/s |
| Minimum Climb [13:44:51] |
-4.6 m/s |
| Units | |
| Speed | |
| Maximum Speed [14:00:27] |
64.1 km/h |
| Average Speed around course |
21.6 km/h |
| Average Speed over track length |
32.3 km/h |
| Units | |
| Tracklog | |
| Flight Duration | 1hr 52mins |
| Track Points | 674 |
| Recording Interval | 10 secs |
| Statistics Interval | 10 secs |
| Track Length | 60.8 km |
| Units | |
| Flight instrument - reported as | |
| 5020 SN05537 SW1.18 |
| Height: | |
| Speed: | |
| Climb: | |
| Distance: |
| Main Map: |
| First Tab: |