Xc Title
User:Guest
Cloudbase Paragliding advert
Alistair Guthrie  All flights
National League 2012
Flight type image
FAI Triangle on a Paraglider
Club
Northumbria
Glider
Ozone Mantra M4
Date
10th August 2012
Start
15:37
Finish
17:58
Duration
2hrs 21mins
Takeoff
Blease fell
Coords
Takeoff
54.62548, -3.07232
Start
54.61102, -3.10705
TP1
54.69377, -3.11908
TP2
54.66873, -2.95670
TP3
54.56603, -3.04417
Finish
54.60520, -3.10723
Landing
54.59693, -3.14125
Distances and Score
Leg 1
15.02k
Leg 2
10.84k
Leg 3
12.75k
Distance
38.61k
Deductions
0.65k  (circuit gap 648m)
Total
37.96k
Multiplier
x 2.80
Score
106.3
Open Distance
Total
16.6k
Filename
Use full pilot name
Download
Validated
Yes
Flight map
Notes

This map gives an overview of the flight, using the turnpoints to plot the track.

Use the for a detailed map and flight track.

Duration 0:00   Takeoff Distance 0
Controls
To animate the flight: click a point on the track, use the slider, or click the Play button.
slider
slider
Speed
Speed
Slower
Faster
Track color
No data
Highlights
Track data
Time: No data
Height:
Climb:
Speed:
Interval:
Units
Height: metres
Climb: m/sec
Speed: km/h
Distance: km
chart
Notes

Climb and Speed averaged over 10 second intervals.

These values may be lower than those shown by a flight instrument, which has access to continuous raw data.

Metric units are used for all chart data, except for Height which is shown in feet.

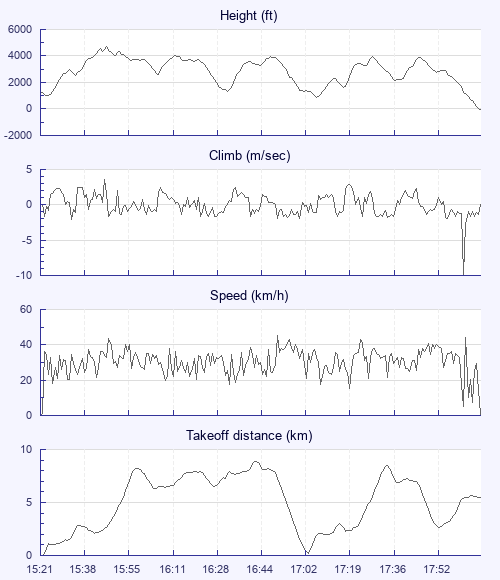
Height   -   Pressure data
Maximum Height
[15:46:53]
4688 ft
Lowest Save
[17:07:53]
837 ft
Takeoff Height
[15:21:50]
1253 ft
Landing Height
[18:10:21]
-36 ft
Total Ascent 16588 ft
Height Gain
Above Takeoff 3435 ft
Maximum 3694 ft
Low Point
[15:24:41]
994 ft
High Point
as Maximum Height
4688 ft
Units
Climb   -   Pressure data
Maximum Climb
[15:46:23]
3.6 m/s
Minimum Climb
[18:04:28]
-9.9 m/s
Units
Speed
Maximum Speed
[16:52:01]
45.4 km/h
Average Speed
around course
16.0 km/h
Average Speed
over track length
30.0 km/h
Units
Tracklog
Flight Duration 2hrs 48mins
Track Points 1010
Recording Interval 10 secs
Statistics Interval 10 secs
Track Length 84.3 km
Units
Flight instrument
Type Brauniger
Model Competino+
Firmware 3.05
Notes

Climb and Speed averaged over 10 second intervals.

These values may be lower than those shown by a flight instrument, which has access to continuous raw data.

Average Speed around course is measured from Start to Finish points.

Track Length is the cumulative distance between track points from Takeoff to Landing.

You can change the default units displayed - see the Options page.

Use this page to set various display Options. You can choose which units are used to display flight data, which map to show when the starts and which tab to show each time you view a flight.
Units settings

Metric units are used by default for the Statistics and XC Player pages, except for Height data which is shown in feet. You can choose your own custom settings here.

Height:
Speed:
Climb:
Distance:
  Use default
XC Player settings

When the XC Player starts, the track data is shown on the Hybrid map. You can choose a different map here.

Main Map:
  Use default
Tab settings

The first tab shown when you view a flight is the Flight Map. You can choose a different tab here.

First Tab:
  Use default
Notes

This page uses cookies to save your settings for future visits.

If you have disabled cookies for this site then any changes you make will not be saved.