


| Duration | 0:00 | Takeoff Distance | 0 |
| Height: | metres |
| Climb: | m/sec |
| Speed: | km/h |
| Distance: | km |
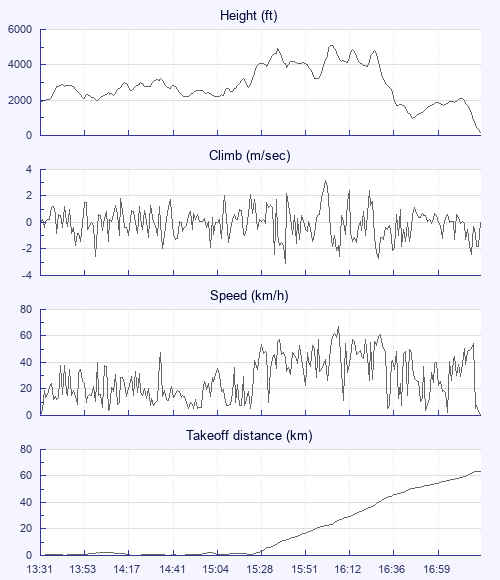
| Height - GPS data | |
| Maximum Height [16:05:10] |
5108 ft |
| Lowest Save [16:48:11] |
961 ft |
| Takeoff Height [13:31:14] |
1880 ft |
| Landing Height [17:23:49] |
190 ft |
| Total Ascent | 13898 ft |
| Height Gain | |
| Above Takeoff | 3228 ft |
| Units | |
| Climb - Pressure data | |
| Maximum Climb [16:03:09] |
3.2 m/s |
| Minimum Climb [15:41:28] |
-3.1 m/s |
| Units | |
| Speed | |
| Maximum Speed [16:08:12] |
67.3 km/h |
| Average Speed around course |
19.8 km/h |
| Average Speed over track length |
28.3 km/h |
| Units | |
| Tracklog | |
| Flight Duration | 3hrs 52mins |
| Track Points | 1385 |
| Recording Interval | 10 secs |
| Statistics Interval | 10 secs |
| Track Length | 109.6 km |
| Units | |
| Flight instrument - reported as | |
| 5020 SN05463 SW1.18 |
| Height: | |
| Speed: | |
| Climb: | |
| Distance: |
| Main Map: |
| First Tab: |