


| Duration | 0:00 | Takeoff Distance | 0 |
| Height: | metres |
| Climb: | m/sec |
| Speed: | km/h |
| Distance: | km |
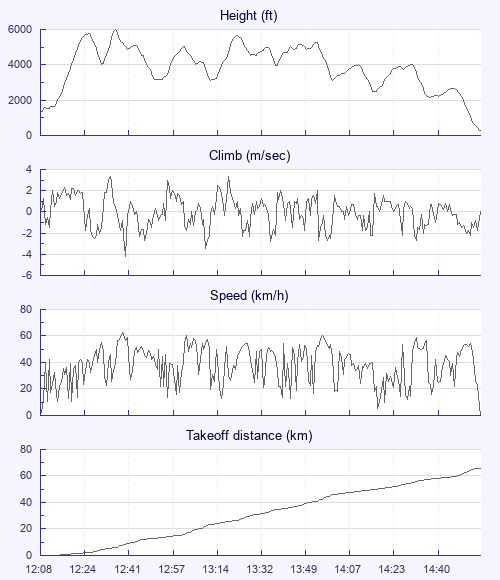
| Height - GPS data | |
| Maximum Height [12:37:30] |
5981 ft |
| Lowest Save [14:40:06] |
2175 ft |
| Takeoff Height [12:08:06] |
1339 ft |
| Landing Height [14:59:37] |
262 ft |
| Total Ascent | 17982 ft |
| Height Gain | |
| Above Takeoff | 4642 ft |
| Maximum | 4675 ft |
| Low Point [12:08:36] |
1306 ft |
| High Point as Maximum Height |
5981 ft |
| Units | |
| Climb - Pressure data | |
| Maximum Climb [12:35:24] |
3.3 m/s |
| Minimum Climb [12:40:36] |
-4.2 m/s |
| Units | |
| Speed | |
| Maximum Speed [12:39:48] |
63.0 km/h |
| Average Speed around course |
25.6 km/h |
| Average Speed over track length |
38.4 km/h |
| Units | |
| Tracklog | |
| Flight Duration | 2hrs 51mins |
| Track Points | 1716 |
| Recording Interval | 6 secs |
| Statistics Interval | 6 secs |
| Track Length | 109.9 km |
| Units | |
| Height: | |
| Speed: | |
| Climb: | |
| Distance: |
| Main Map: |
| First Tab: |