


| Duration | 0:00 | Takeoff Distance | 0 |
| Height: | metres |
| Climb: | m/sec |
| Speed: | km/h |
| Distance: | km |
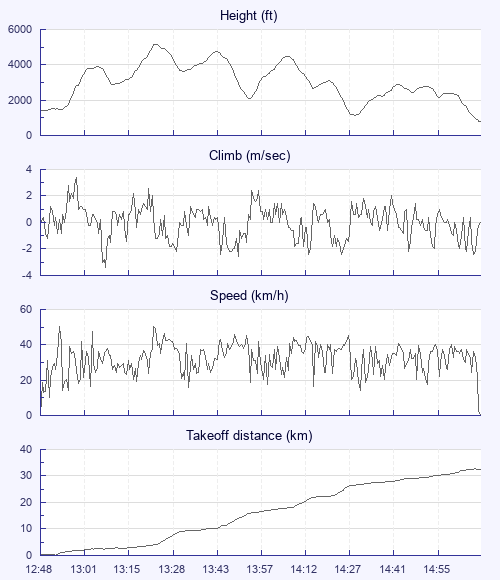
| Height - GPS data | |
| Maximum Height [13:24:09] |
5154 ft |
| Lowest Save [14:31:23] |
1158 ft |
| Takeoff Height [12:48:36] |
1437 ft |
| Landing Height [15:12:24] |
774 ft |
| Total Ascent | 11312 ft |
| Height Gain | |
| Above Takeoff | 3717 ft |
| Maximum | 3750 ft |
| Low Point [12:49:11] |
1404 ft |
| High Point as Maximum Height |
5154 ft |
| Units | |
| Climb - Pressure data | |
| Maximum Climb [12:59:41] |
3.4 m/s |
| Minimum Climb [13:08:13] |
-3.4 m/s |
| Units | |
| Speed | |
| Maximum Speed [12:53:54] |
50.4 km/h |
| Average Speed around course |
17.3 km/h |
| Average Speed over track length |
32.7 km/h |
| Units | |
| Tracklog | |
| Flight Duration | 2hrs 23mins |
| Track Points | 1718 |
| Recording Interval | 5 secs |
| Statistics Interval | 5 secs |
| Track Length | 78.4 km |
| Units | |
| Flight instrument - reported as | |
| COMPETINO SN00827 SW1.21 |
| Height: | |
| Speed: | |
| Climb: | |
| Distance: |
| Main Map: |
| First Tab: |