


| Duration | 0:00 | Takeoff Distance | 0 |
| Height: | metres |
| Climb: | m/sec |
| Speed: | km/h |
| Distance: | km |
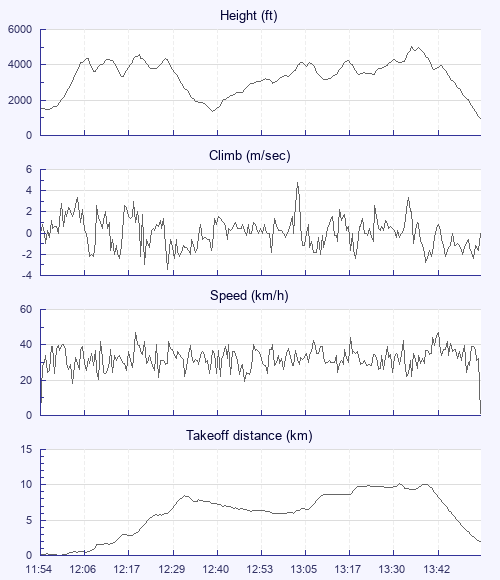
| Height - GPS data | |
| Maximum Height [13:35:31] |
5056 ft |
| Lowest Save [12:39:41] |
1362 ft |
| Takeoff Height [11:54:01] |
1519 ft |
| Landing Height [13:54:31] |
971 ft |
| Total Ascent | 13320 ft |
| Height Gain | |
| Above Takeoff | 3537 ft |
| Maximum | 3694 ft |
| Low Point as Lowest Save |
1362 ft |
| High Point as Maximum Height |
5056 ft |
| Units | |
| Climb - GPS data | |
| Maximum Climb [13:03:26] |
4.8 m/s |
| Minimum Climb [12:27:36] |
-3.4 m/s |
| Units | |
| Speed | |
| Maximum Speed [12:19:16] |
46.8 km/h |
| Average Speed around course |
11.8 km/h |
| Average Speed over track length |
32.3 km/h |
| Units | |
| Tracklog | |
| Flight Duration | 2hrs |
| Track Points | 1447 |
| Recording Interval | 5 secs |
| Statistics Interval | 5 secs |
| Track Length | 64.8 km |
| Units | |
| Flight instrument - reported as | |
| CPILOT |
| Height: | |
| Speed: | |
| Climb: | |
| Distance: |
| Main Map: |
| First Tab: |