


| Duration | 0:00 | Takeoff Distance | 0 |
| Height: | metres |
| Climb: | m/sec |
| Speed: | km/h |
| Distance: | km |
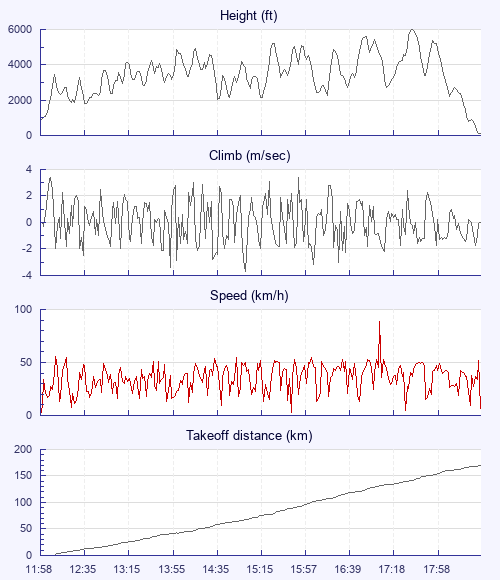
| Height - GPS data | |
| Maximum Height [17:46:50] |
5974 ft |
| Lowest Save [12:36:58] |
1795 ft |
| Takeoff Height [11:58:52] |
876 ft |
| Landing Height [18:50:58] |
121 ft |
| Total Ascent | 43822 ft |
| Height Gain | |
| Above Takeoff | 5098 ft |
| Units | |
| Climb - Pressure data | |
| Maximum Climb [12:04:13] |
3.4 m/s |
| Minimum Climb [15:07:58] |
-3.7 m/s |
| Units | |
| Speed | |
| Maximum Speed [17:17:37] |
88.8 km/h |
| Average Speed around course |
25.9 km/h |
| Average Speed over track length |
34.2 km/h |
| Units | |
| Tracklog | |
| Flight Duration | 6hrs 52mins |
| Track Points | 2468 |
| Recording Interval | 10 secs |
| Statistics Interval | 10 secs |
| Track Length | 234.9 km |
| Invalid Positions [< 1%] |
1 |
| Units | |
| Flight instrument - reported as | |
| 5020 SN05888 SW1.22 |
| Height: | |
| Speed: | |
| Climb: | |
| Distance: |
| Main Map: |
| First Tab: |