


| Duration | 0:00 | Takeoff Distance | 0 |
| Height: | metres |
| Climb: | m/sec |
| Speed: | km/h |
| Distance: | km |
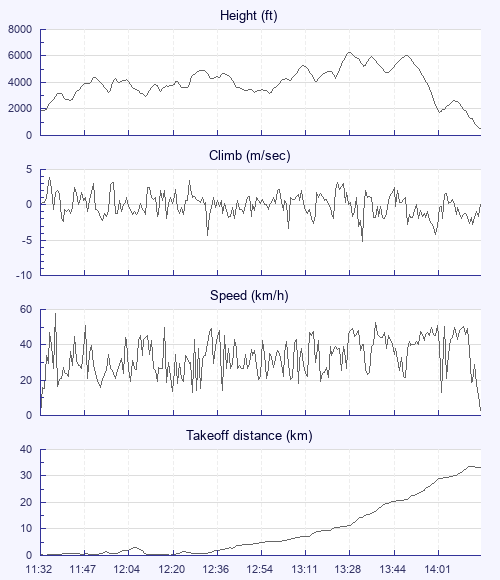
| Height - GPS data | |
| Maximum Height [13:31:04] |
6257 ft |
| Lowest Save [14:05:14] |
1755 ft |
| Takeoff Height [11:32:29] |
1788 ft |
| Landing Height [14:19:14] |
528 ft |
| Total Ascent | 17730 ft |
| Height Gain | |
| Above Takeoff | 4469 ft |
| Units | |
| Climb - Pressure data | |
| Maximum Climb [11:35:49] |
3.8 m/s |
| Minimum Climb [13:35:04] |
-5.2 m/s |
| Units | |
| Speed | |
| Maximum Speed [11:37:44] |
57.6 km/h |
| Average Speed around course |
16.2 km/h |
| Average Speed over track length |
33.4 km/h |
| Units | |
| Tracklog | |
| Flight Duration | 2hrs 46mins |
| Track Points | 2002 |
| Recording Interval | 5 secs |
| Statistics Interval | 5 secs |
| Track Length | 92.8 km |
| Units | |
| Flight instrument - reported as | |
| IQ-BASIC |
| Height: | |
| Speed: | |
| Climb: | |
| Distance: |
| Main Map: |
| First Tab: |