


| Duration | 0:00 | Takeoff Distance | 0 |
| Height: | metres |
| Climb: | m/sec |
| Speed: | km/h |
| Distance: | km |
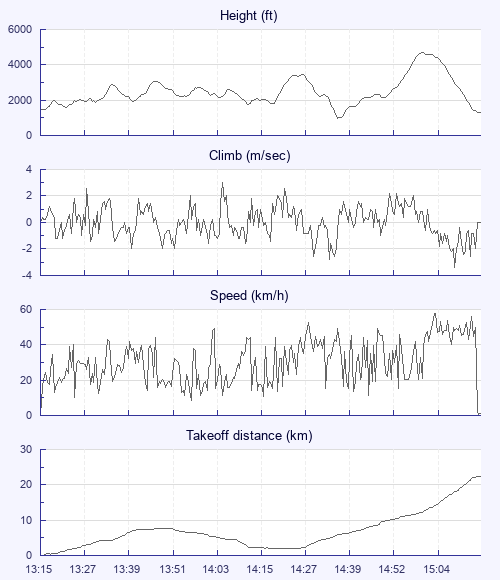
| Height - GPS data | |
| Maximum Height [15:02:50] |
4675 ft |
| Lowest Save [14:39:05] |
974 ft |
| Takeoff Height [13:15:40] |
1440 ft |
| Landing Height [15:17:25] |
1302 ft |
| Total Ascent | 11709 ft |
| Height Gain | |
| Above Takeoff | 3235 ft |
| Maximum | 3701 ft |
| Low Point as Lowest Save |
974 ft |
| High Point as Maximum Height |
4675 ft |
| Units | |
| Climb - GPS data | |
| Maximum Climb [14:06:20] |
3.0 m/s |
| Minimum Climb [15:11:30] |
-3.4 m/s |
| Units | |
| Speed | |
| Maximum Speed [15:06:05] |
57.6 km/h |
| Average Speed around course |
18.6 km/h |
| Average Speed over track length |
29.6 km/h |
| Units | |
| Tracklog | |
| Flight Duration | 2hrs 1min |
| Track Points | 1462 |
| Recording Interval | 5 secs |
| Statistics Interval | 5 secs |
| Track Length | 60.1 km |
| Units | |
| Flight instrument - reported as | |
| GPSMap76C Software Version 3.50 |
| Height: | |
| Speed: | |
| Climb: | |
| Distance: |
| Main Map: |
| First Tab: |