


| Duration | 0:00 | Takeoff Distance | 0 |
| Height: | metres |
| Climb: | m/sec |
| Speed: | km/h |
| Distance: | km |
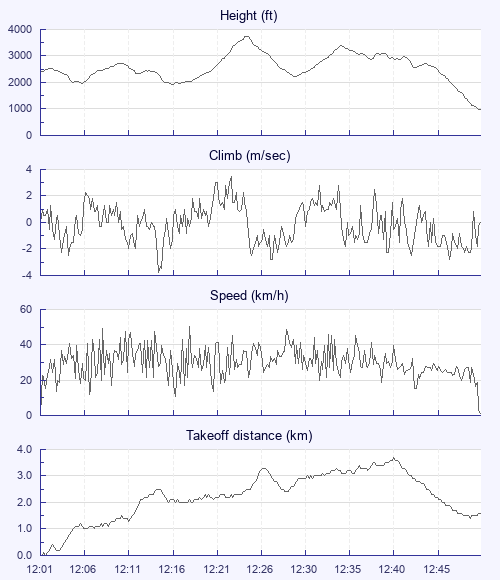
| Height - GPS data | |
| Maximum Height [12:24:55] |
3753 ft |
| Lowest Save [12:16:35] |
1929 ft |
| Takeoff Height [12:01:55] |
2382 ft |
| Landing Height [12:51:43] |
968 ft |
| Total Ascent | 4934 ft |
| Height Gain | |
| Above Takeoff | 1371 ft |
| Maximum | 1824 ft |
| Low Point as Lowest Save |
1929 ft |
| High Point as Maximum Height |
3753 ft |
| Units | |
| Climb - GPS data | |
| Maximum Climb [12:23:07] |
3.5 m/s |
| Minimum Climb [12:15:15] |
-3.8 m/s |
| Units | |
| Speed | |
| Maximum Speed [12:18:23] |
50.4 km/h |
| Average Speed around course |
13.5 km/h |
| Average Speed over track length |
30.0 km/h |
| Units | |
| Tracklog | |
| Flight Duration | 49mins |
| Track Points | 748 |
| Recording Interval | 4 secs |
| Statistics Interval | 4 secs |
| Track Length | 24.9 km |
| Units | |
| Flight instrument - reported as | |
| GPSMap60CX Software Version 3.90 |
| Height: | |
| Speed: | |
| Climb: | |
| Distance: |
| Main Map: |
| First Tab: |