


| Duration | 0:00 | Takeoff Distance | 0 |
| Height: | metres |
| Climb: | m/sec |
| Speed: | km/h |
| Distance: | km |
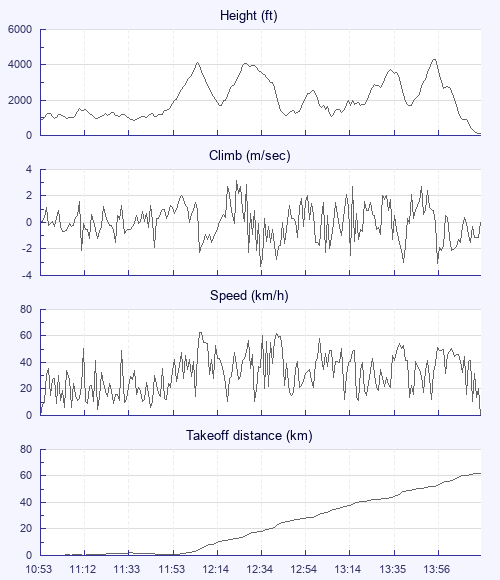
| Height - GPS data | |
| Maximum Height [14:00:38] |
4298 ft |
| Lowest Save [11:36:53] |
827 ft |
| Takeoff Height [10:53:53] |
879 ft |
| Landing Height [14:20:53] |
92 ft |
| Total Ascent | 19606 ft |
| Height Gain | |
| Above Takeoff | 3419 ft |
| Maximum | 3471 ft |
| Low Point as Lowest Save |
827 ft |
| High Point as Maximum Height |
4298 ft |
| Units | |
| Climb - GPS data | |
| Maximum Climb [12:26:23] |
3.2 m/s |
| Minimum Climb [12:37:38] |
-3.3 m/s |
| Units | |
| Speed | |
| Maximum Speed [12:09:53] |
62.9 km/h |
| Average Speed around course |
20.2 km/h |
| Average Speed over track length |
31.0 km/h |
| Units | |
| Tracklog | |
| Flight Duration | 3hrs 27mins |
| Track Points | 829 |
| Recording Interval | 15 secs |
| Statistics Interval | 15 secs |
| Track Length | 107.1 km |
| Units | |
| Flight instrument - reported as | |
| GPSMap76CX Software Version 4.20 |
| Height: | |
| Speed: | |
| Climb: | |
| Distance: |
| Main Map: |
| First Tab: |