


| Duration | 0:00 | Takeoff Distance | 0 |
| Height: | metres |
| Climb: | m/sec |
| Speed: | km/h |
| Distance: | km |
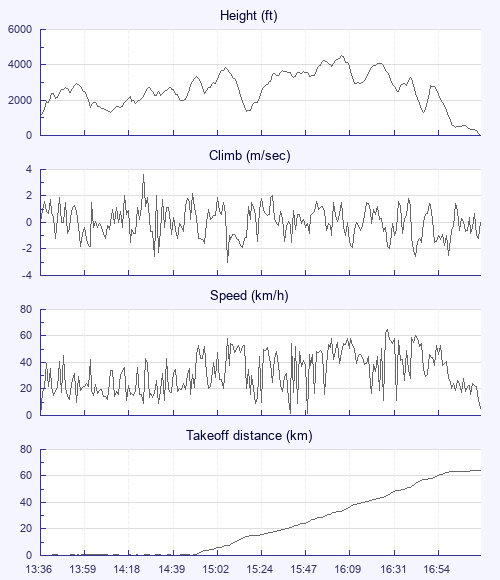
| Height - GPS data | |
| Maximum Height [16:06:33] |
4528 ft |
| Lowest Save [14:10:33] |
1306 ft |
| Takeoff Height [13:36:03] |
1148 ft |
| Landing Height [17:15:53] |
20 ft |
| Total Ascent | 19875 ft |
| Height Gain | |
| Above Takeoff | 3379 ft |
| Units | |
| Climb - Pressure data | |
| Maximum Climb [14:25:13] |
3.6 m/s |
| Minimum Climb [15:07:33] |
-3.0 m/s |
| Units | |
| Speed | |
| Maximum Speed [16:29:23] |
64.8 km/h |
| Average Speed around course |
20.9 km/h |
| Average Speed over track length |
32.4 km/h |
| Units | |
| Tracklog | |
| Flight Duration | 3hrs 39mins |
| Track Points | 1320 |
| Recording Interval | 10 secs |
| Statistics Interval | 10 secs |
| Track Length | 118.6 km |
| Units | |
| Flight instrument | |
| Type | Compass S.r.l - Www.compass-italy.com |
| Model | C-pilotpro |
| Firmware | |
| Height: | |
| Speed: | |
| Climb: | |
| Distance: |
| Main Map: |
| First Tab: |