


| Duration | 0:00 | Takeoff Distance | 0 |
| Height: | metres |
| Climb: | m/sec |
| Speed: | km/h |
| Distance: | km |
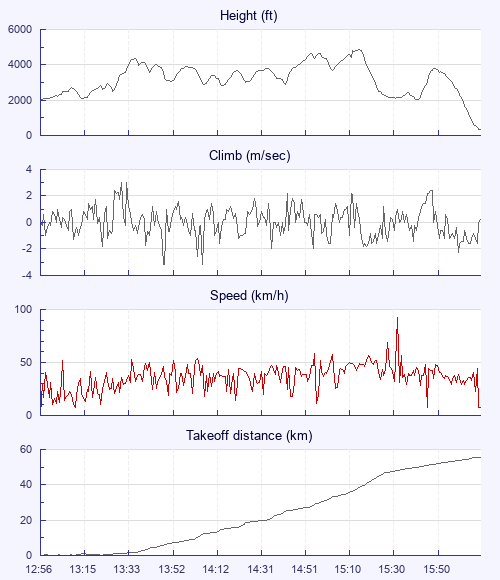
| Height - GPS data | |
| Maximum Height [15:18:53] |
4879 ft |
| Lowest Save [15:45:03] |
2037 ft |
| Takeoff Height [12:56:29] |
2031 ft |
| Landing Height [16:12:23] |
341 ft |
| Total Ascent | 15663 ft |
| Height Gain | |
| Above Takeoff | 2848 ft |
| Units | |
| Climb - GPS data | |
| Maximum Climb [13:32:26] |
3.0 m/s |
| Minimum Climb [13:49:35] |
-3.2 m/s |
| Units | |
| Speed | |
| Maximum Speed [15:36:33] |
92.9 km/h |
| Average Speed around course |
22.0 km/h |
| Average Speed over track length |
34.4 km/h |
| Units | |
| Tracklog | |
| Flight Duration | 3hrs 15mins |
| Track Points | 2445 |
| Recording Interval | 5 secs |
| Statistics Interval | 5 secs |
| Track Length | 112.4 km |
| Invalid Positions [< 1%] |
1 |
| Units | |
| Flight instrument - reported as | |
| GPSMap76CSX Software Version 4.10 |
| Height: | |
| Speed: | |
| Climb: | |
| Distance: |
| Main Map: |
| First Tab: |