


| Duration | 0:00 | Takeoff Distance | 0 |
| Height: | metres |
| Climb: | m/sec |
| Speed: | km/h |
| Distance: | km |
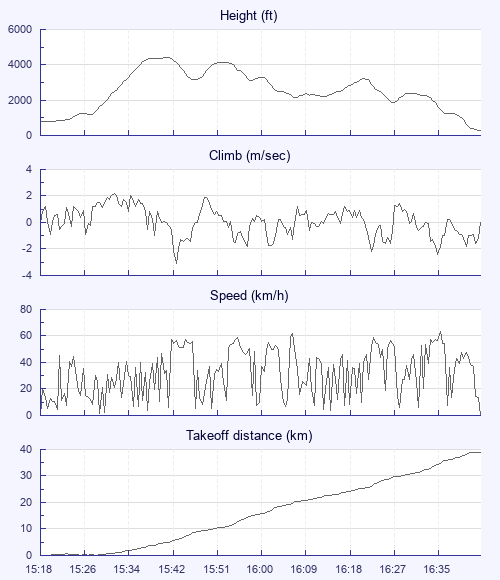
| Height - GPS data | |
| Maximum Height [15:42:35] |
4400 ft |
| Lowest Save [16:29:15] |
1850 ft |
| Takeoff Height [15:18:25] |
751 ft |
| Landing Height [16:46:25] |
262 ft |
| Total Ascent | 7306 ft |
| Height Gain | |
| Above Takeoff | 3648 ft |
| Units | |
| Climb - Pressure data | |
| Maximum Climb [15:32:15] |
2.2 m/s |
| Minimum Climb [15:44:05] |
-3.1 m/s |
| Units | |
| Speed | |
| Maximum Speed [16:38:55] |
63.4 km/h |
| Average Speed around course |
28.0 km/h |
| Average Speed over track length |
32.7 km/h |
| Units | |
| Tracklog | |
| Flight Duration | 1hr 28mins |
| Track Points | 529 |
| Recording Interval | 10 secs |
| Statistics Interval | 10 secs |
| Track Length | 48.0 km |
| Units | |
| Flight instrument - reported as | |
| XC Trainer V3.5-11, S/N 124 |
| Height: | |
| Speed: | |
| Climb: | |
| Distance: |
| Main Map: |
| First Tab: |