


| Duration | 0:00 | Takeoff Distance | 0 |
| Height: | metres |
| Climb: | m/sec |
| Speed: | km/h |
| Distance: | km |
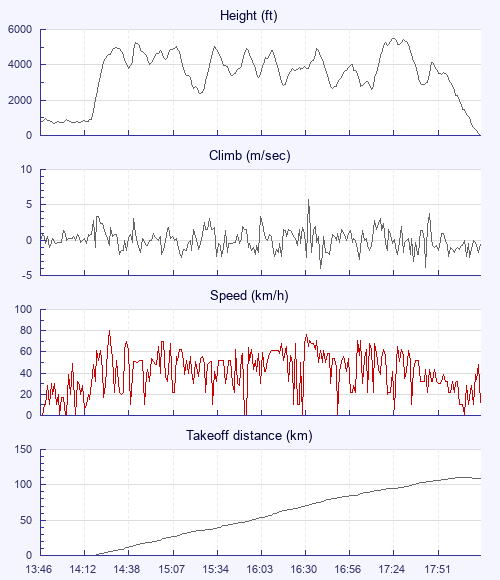
| Height - GPS data | |
| Maximum Height [17:25:10] |
5518 ft |
| Lowest Save [15:24:57] |
2372 ft |
| Takeoff Height [13:46:32] |
712 ft |
| Landing Height [18:15:31] |
0 ft |
| Total Ascent | 28855 ft |
| Height Gain | |
| Above Takeoff | 4806 ft |
| Maximum | 4816 ft |
| Low Point [13:53:59] |
702 ft |
| High Point as Maximum Height |
5518 ft |
| Units | |
| Climb - GPS data | |
| Maximum Climb [16:32:02] |
5.8 m/s |
| Minimum Climb [16:39:14] |
-4.0 m/s |
| Units | |
| Speed | |
| Maximum Speed [14:27:16] |
80.1 km/h |
| Average Speed around course |
29.5 km/h |
| Average Speed over track length |
40.8 km/h |
| Units | |
| Tracklog | |
| Flight Duration | 4hrs 28mins |
| Track Points | 16140 |
| Recording Interval | 1 secs |
| Statistics Interval | 4 secs |
| Track Length | 182.9 km |
| Invalid Positions [< 1%] |
52 |
| Units | |
| Height: | |
| Speed: | |
| Climb: | |
| Distance: |
| Main Map: |
| First Tab: |