


| Duration | 0:00 | Takeoff Distance | 0 |
| Height: | metres |
| Climb: | m/sec |
| Speed: | km/h |
| Distance: | km |
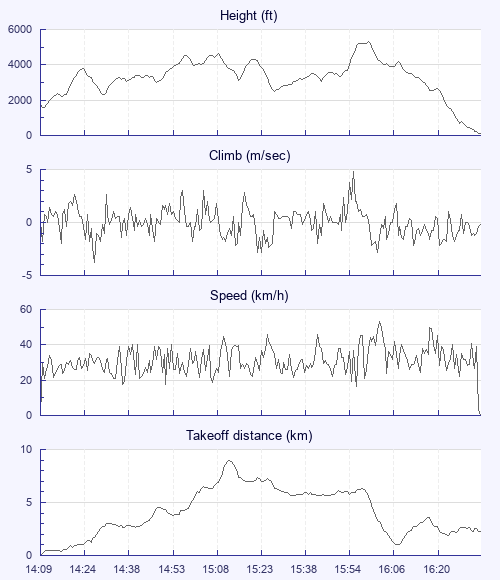
| Height - GPS data | |
| Maximum Height [16:00:53] |
5338 ft |
| Lowest Save [14:30:58] |
2323 ft |
| Takeoff Height [14:09:33] |
1736 ft |
| Landing Height [16:38:28] |
98 ft |
| Total Ascent | 14295 ft |
| Height Gain | |
| Above Takeoff | 3602 ft |
| Maximum | 3822 ft |
| Low Point [14:10:23] |
1516 ft |
| High Point as Maximum Height |
5338 ft |
| Units | |
| Climb - GPS data | |
| Maximum Climb [15:57:48] |
4.8 m/s |
| Minimum Climb [14:28:23] |
-3.8 m/s |
| Units | |
| Speed | |
| Maximum Speed [16:04:23] |
53.3 km/h |
| Average Speed around course |
12.5 km/h |
| Average Speed over track length |
30.9 km/h |
| Units | |
| Tracklog | |
| Flight Duration | 2hrs 28mins |
| Track Points | 1788 |
| Recording Interval | 5 secs |
| Statistics Interval | 5 secs |
| Track Length | 76.6 km |
| Units | |
| Flight instrument - reported as | |
| Garmin USB: GPSmap 96C Software Version 3.00 |
| Height: | |
| Speed: | |
| Climb: | |
| Distance: |
| Main Map: |
| First Tab: |