


| Duration | 0:00 | Takeoff Distance | 0 |
| Height: | metres |
| Climb: | m/sec |
| Speed: | km/h |
| Distance: | km |
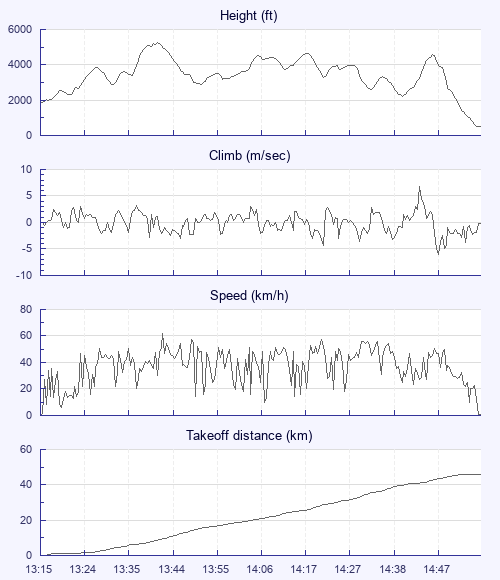
| Height - GPS data | |
| Maximum Height [13:41:57] |
5236 ft |
| Lowest Save [14:40:50] |
2234 ft |
| Takeoff Height [13:15:04] |
1890 ft |
| Landing Height [14:56:22] |
492 ft |
| Total Ascent | 13648 ft |
| Height Gain | |
| Above Takeoff | 3346 ft |
| Units | |
| Climb - Pressure data | |
| Maximum Climb [14:43:52] |
6.8 m/s |
| Minimum Climb [14:48:12] |
-6.0 m/s |
| Units | |
| Speed | |
| Maximum Speed [13:42:52] |
62.1 km/h |
| Average Speed around course |
28.8 km/h |
| Average Speed over track length |
37.0 km/h |
| Units | |
| Tracklog | |
| Flight Duration | 1hr 41mins |
| Track Points | 6079 |
| Recording Interval | 1 secs |
| Statistics Interval | 4 secs |
| Track Length | 62.5 km |
| Units | |
| Flight instrument - reported as | |
| Flymaster F1, V1.3, S/N 2474 |
| Height: | |
| Speed: | |
| Climb: | |
| Distance: |
| Main Map: |
| First Tab: |