Xc Title
User:Guest
Cloudbase Paragliding advert
Roger Brown  All flights
National League 2014
Flight type image
Turnpoint Flight on a Paraglider
Club
Thames Valley
Glider
Gradient Aspen 4
Date
22nd June 2014
Start
12:54
Finish
14:39
Duration
1hr 44mins
Takeoff
Blorenge
Landing
Nr Hay Bluff
Coords
Takeoff
51.80475, -3.04867
Start
51.80475, -3.04867
TP1
51.82683, -3.03067
TP2
51.89897, -3.13988
TP3
51.98255, -3.16050
Finish
52.01017, -3.11725
Landing
52.01013, -3.11725
Distances and Score
Leg 1
2.75k
Leg 2
11.00k
Leg 3
9.41k
Leg 4
4.27k
Total
27.43k
Score
27.4
Open Distance
Total
23.6k
Filename
Use full pilot name
Download
Validated
Yes
Flight map
Notes

This map gives an overview of the flight, using the turnpoints to plot the track.

Use the for a detailed map and flight track.

Duration 0:00   Takeoff Distance 0
Controls
To animate the flight: click a point on the track, use the slider, or click the Play button.
slider
slider
Speed
Speed
Slower
Faster
Track color
No data
Highlights
Track data
Time: No data
Height:
Climb:
Speed:
Interval:
Units
Height: metres
Climb: m/sec
Speed: km/h
Distance: km
chart
Notes

Climb and Speed averaged over 10 second intervals.

These values may be lower than those shown by a flight instrument, which has access to continuous raw data.

Metric units are used for all chart data, except for Height which is shown in feet.

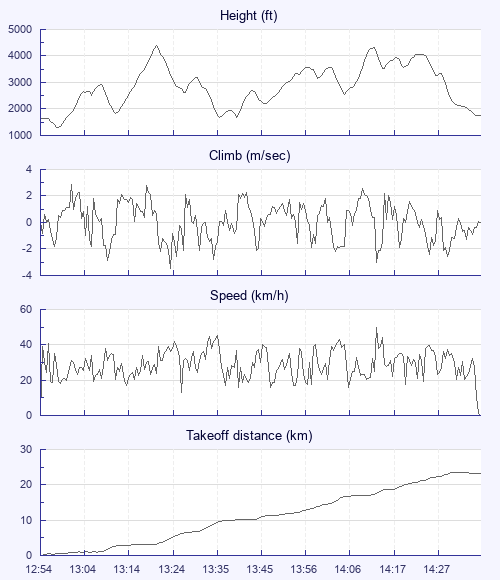
Height   -   Pressure data
Maximum Height
[13:21:35]
4406 ft
Lowest Save
[13:41:05]
1673 ft
Takeoff Height
[12:54:35]
1667 ft
Landing Height
[14:39:45]
1772 ft
Total Ascent 11719 ft
Height Gain
Above Takeoff 2740 ft
Maximum 3120 ft
Low Point
[12:58:05]
1286 ft
High Point
as Maximum Height
4406 ft
Units
Climb   -   Pressure data
Maximum Climb
[13:01:15]
2.9 m/s
Minimum Climb
[13:25:05]
-3.5 m/s
Units
Speed
Maximum Speed
[14:15:35]
49.7 km/h
Average Speed
around course
15.7 km/h
Average Speed
over track length
29.2 km/h
Units
Tracklog
Flight Duration 1hr 45mins
Track Points 632
Recording Interval 10 secs
Statistics Interval 10 secs
Track Length 51.1 km
Units
Flight instrument   -   reported as
XC Trainer V3.5-01, S/N 4129
Notes

Climb and Speed averaged over 10 second intervals.

These values may be lower than those shown by a flight instrument, which has access to continuous raw data.

Average Speed around course is measured from Start to Finish points.

Track Length is the cumulative distance between track points from Takeoff to Landing.

You can change the default units displayed - see the Options page.

Use this page to set various display Options. You can choose which units are used to display flight data, which map to show when the starts and which tab to show each time you view a flight.
Units settings

Metric units are used by default for the Statistics and XC Player pages, except for Height data which is shown in feet. You can choose your own custom settings here.

Height:
Speed:
Climb:
Distance:
  Use default
XC Player settings

When the XC Player starts, the track data is shown on the Hybrid map. You can choose a different map here.

Main Map:
  Use default
Tab settings

The first tab shown when you view a flight is the Flight Map. You can choose a different tab here.

First Tab:
  Use default
Notes

This page uses cookies to save your settings for future visits.

If you have disabled cookies for this site then any changes you make will not be saved.