Xc Title
User:Guest
UK Airsports advert
Milton Turner  All flights
National League 2014
Flight type image
Turnpoint Flight on a Paraglider
Club
Derbyshire
Glider
Ozone Delta 2
Date
11th April 2014
Start
11:31
Finish
15:25
Duration
3hrs 53mins
Takeoff
Bradwell
Landing
Nr Corby Glen
Coords
Takeoff
53.32070, -1.73033
Start
53.32658, -1.72910
TP1
53.32422, -1.73925
TP2
53.19773, -1.43845
TP3
53.19457, -1.24437
Finish
52.80547, -0.50460
Landing
52.80752, -0.50702
Distances and Score
Leg 1
0.73k
Leg 2
24.52k
Leg 3
12.98k
Leg 4
65.89k
Total
104.12k
Score
104.1
Open Distance
Total
100.9k
Filename
Use full pilot name
Download
Validated
Yes
Flight map
Notes

This map gives an overview of the flight, using the turnpoints to plot the track.

Use the for a detailed map and flight track.

Duration 0:00   Takeoff Distance 0
Controls
To animate the flight: click a point on the track, use the slider, or click the Play button.
slider
slider
Speed
Speed
Slower
Faster
Track color
No data
Highlights
Track data
Time: No data
Height:
Climb:
Speed:
Interval:
Units
Height: metres
Climb: m/sec
Speed: km/h
Distance: km
chart
Notes

Climb and Speed averaged over 6 second intervals.

These values may be lower than those shown by a flight instrument, which has access to continuous raw data.

Metric units are used for all chart data, except for Height which is shown in feet.

Height   -   GPS data
Maximum Height
[13:50:03]
5089 ft
Lowest Save
[14:29:15]
1824 ft
Takeoff Height
[11:28:57]
1214 ft
Landing Height
[15:26:18]
256 ft
Total Ascent 27320 ft
Height Gain
Above Takeoff 3875 ft
Maximum 3878 ft
Low Point
[11:31:51]
1211 ft
High Point
as Maximum Height
5089 ft
Units
Climb   -   Pressure data
Maximum Climb
[13:07:57]
3.5 m/s
Minimum Climb
[13:57:03]
-4.2 m/s
Units
Speed
Maximum Speed
[13:50:51]
57.6 km/h
Average Speed
around course
26.7 km/h
Average Speed
over track length
37.5 km/h
Units
Tracklog
Flight Duration 3hrs 57mins
Track Points 4748
Recording Interval 3 secs
Statistics Interval 6 secs
Track Length 148.2 km
Units
Flight instrument   -   reported as
Flymaster F1, V1.3, S/N 1787
Notes

Climb and Speed averaged over 6 second intervals.

These values may be lower than those shown by a flight instrument, which has access to continuous raw data.

Average Speed around course is measured from Start to Finish points.

Track Length is the cumulative distance between track points from Takeoff to Landing.

You can change the default units displayed - see the Options page.

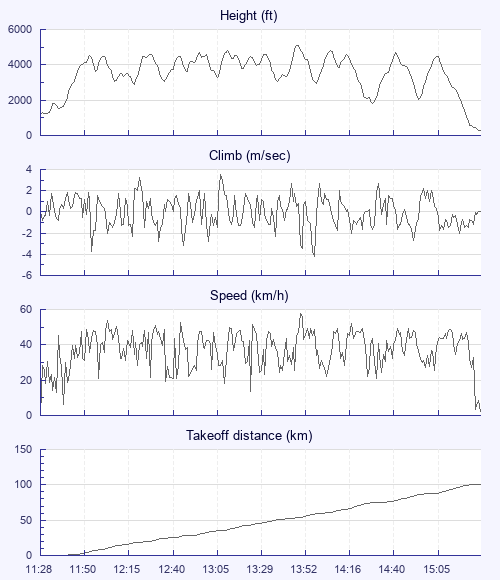
Took off and it wasn't long before a group of us started winding out. It seemed quite slow, both the climb and drift. Arriving west of Chesterfield there was lift but it was really fragmented, which flummoxed me a bit. Decided to really slow down and eek things out till well past the M1. Found the only solid 6up thermal of the whole flight several k past the M1 and entered the wisps a bit for the first time at about 4600ft. Base rose a bit later, 5100ft, with clouds giving reliable, if a little rough, lift. Past Newark the base dropped to about 4300 which surprised me. The nicest part was finding 3 buzzards at 2000 ft. At Bottesford and winding up to 4000ft with them on the way to Grantham.

Use this page to set various display Options. You can choose which units are used to display flight data, which map to show when the starts and which tab to show each time you view a flight.
Units settings

Metric units are used by default for the Statistics and XC Player pages, except for Height data which is shown in feet. You can choose your own custom settings here.

Height:
Speed:
Climb:
Distance:
  Use default
XC Player settings

When the XC Player starts, the track data is shown on the Hybrid map. You can choose a different map here.

Main Map:
  Use default
Tab settings

The first tab shown when you view a flight is the Flight Map. You can choose a different tab here.

First Tab:
  Use default
Notes

This page uses cookies to save your settings for future visits.

If you have disabled cookies for this site then any changes you make will not be saved.